. 2008 Apr 1;121(Pt 7):1036-45.
doi: 10.1242/jcs.019455. Epub 2008 Mar 11.

Jun N-terminal kinase 1 regulates epithelial-to-mesenchymal transition induced by TGF-beta1

Affiliations

Jun N-terminal kinase 1 regulates epithelial-to-mesenchymal transition induced by TGF-beta1

John F Alcorn et al. J Cell Sci. .

Abstract

Transforming growth factor beta1 (TGF-beta1) is a cardinal cytokine in the pathogenesis of airway remodeling, and promotes epithelial-to-mesenchymal transition (EMT). As a molecular interaction between TGF-beta1 and Jun N-terminal kinase (JNK) has been demonstrated, the goal of this study was to elucidate whether JNK plays a role in TGF-beta1-induced EMT. Primary cultures of mouse tracheal epithelial cells (MTEC) from wild-type, JNK1-/- or JNK2-/- mice were comparatively evaluated for their ability to undergo EMT in response to TGF-beta1. Wild-type MTEC exposed to TGF-beta1 demonstrated a prominent induction of mesenchymal mediators and a loss of epithelial markers, in conjunction with a loss of trans-epithelial resistance (TER). Significantly, TGF-beta1-mediated EMT was markedly blunted in epithelial cells lacking JNK1, while JNK2-/- MTEC underwent EMT in response to TGF-beta1 in a similar way to wild-type cells. Although Smad2/3 phosphorylation and nuclear localization of Smad4 were similar in JNK1-/- MTEC in response to TGF-beta1, Smad DNA-binding activity was diminished. Gene expression profiling demonstrated a global suppression of TGF-beta1-modulated genes, including regulators of EMT in JNK1-/- MTEC, in comparison with wild-type cells. In aggregate, these results illuminate the novel role of airway epithelial-dependent JNK1 activation in EMT.


Figures
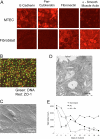
Fig. 1
Fig. 1
Characterization of primary MTEC. (A) Compared to isolated lung fibroblasts, MTEC expressed cytokeratins and E-cadherin, but were negative for fibronectin and α-SMA. (B) MTEC expressed the localized tight junctional protein ZO-1, indicative of barrier function (ZO-1 is depicted by the red stain, whereas the green signal represents the DNA counterstain, Sytox Green). (C) Scanning electron micrograph of MTEC depicting well-defined cell-cell contacts, 2500× magnification. (D) Transmission electron micrograph depicting tight junction formation, desmosomes, nuclei, vacuole; 15000× magnification. (E) Primary MTEC established stable TER in culture. Shown are MTEC cultured under submerged conditions, or cultured on ALI in the presence of absence of retinoic acid (30 nM); TER was measured every other day for 18 days. D, desmosome; N, nucleus; T, tight junction; V, vacuole.
Fig. 2
Fig. 2
Assessment of effects of TGF-β1 in MTEC on expression of mesenchymal and epithelial markers. (A) Evaluation of collagen type 1a1, fibronectin and E-cadherin via immunofluorescence. MTEC were exposed to 5 ng/ml TGF-β1 every other day for 14 days, and prepared for immunofluorescence. Magnification 400×. DAPI illustrates nuclei. (B) MTEC were exposed to 5 ng/ml TGF-β1, and expression of PAI-1 was assessed in cell culture media 24 hours later. α-SMA protein expression was determined in cell lysates following exposure to 0.5 or 5 ng/ml of TGF-β1 for 6 days. Smad3 represents loading control. Different lanes shown represent results from independent samples. (C) Evaluation of mRNA levels of mesenchymal or epithelial genes in MTEC exposed to TGF-β1 treatment (5 ng/ml, every other day for 10 days). To evaluate reversibility of TGF-β1 responses, MTEC were maintained in culture for 6 additional days in the absence of TGF-β1. mRNA expression was evaluated by real-time PCR analysis, and data normalized to the housekeeping gene HPRT. Results are expressed as fold changes from controls. * P<0.05, ANOVA versus control-treated, ** P<0.05, ANOVA versus TGF-β1-treated.
Fig. 3
Fig. 3
Evaluation of Smad and JNK signaling in MTEC exposed to TGF-β1. (A) Assessment of Smad2 phosphorylation and Smad4 nuclear localization in MTEC in response to TGF-β1. Phospho-Smad2 and Smad4 were analyzed by western blot of nuclear extracts, after 120 or 240 minutes of exposure to 5 ng/ml TGF-β1. Note that samples were run on the same gels, but irrelevant lanes were deleted for consistency of presentation. (B) Electrophoretic mobility shift assay evaluating binding of nuclear proteins to the consensus SBE in response to TGF-β1 (10 ng/ml) for the indicated times. (C) Assessment of phosphorylation of JNK1 and JNK2 following stimulation of MTEC with TGF-β1 (5 ng/ml) for the indicated times. The upper band indicates predominantly JNK2, whereas the lower band mainly reflects JNK1. Fold change denotes differences in signal compared to sham controls based upon densitometric evaluation. The lower panel represents total JNK1 and 2 western blot as loading control. Duplicate lanes in panels A, B and C represent results from independent samples.
Fig. 4
Fig. 4
TGF-β1 induces EMT in MTEC in a JNK1-dependent, but JNK2-independent, manner. (A) TGF-β1-induced loss of TER, indicative of barrier disruption, in wild-type MTEC is abrogated in MTEC lacking JNK1–/–, but not in JNK2–/– MTEC. Cells were exposed to 5 ng/ml TGF-β1 every other day for the indicated days of culture. Data are graphed as percentage change in TER from baseline, as recorded over a time period of 10 days. Results represent three independent experiments. Absolute TER readings (Ohms × cm2) before initiation of TGF-β1 exposure were: wild type 1143.3±149.2; JNK1–/– 3521.7±161.4; JNK2–/– 2956.7±150.5 (n=6/group). (B) Comparative evaluation of α-SMA expression in wild-type, JNK1–/– and JNK2–/– MTEC, exposed to TGF-β1 (10 ng/ml, every other day for 8 days). α-SMA expression (Red) was detected by immunofluorescence. Green, Nuclear counterstain, Sytox). The percentage of α-SMA expressing cells was quantified by counting the number of positive cells per field (n>50 cells). (C) Confirmation of genotypes of JNK1–/– or JNK2–/– MTEC by western blot analysis of total JNK.
Fig. 5
Fig. 5
Wild-type and JNK1–/– MTEC display similar growth, morphology and production of mucin in culture. (A) Growth curves of MTEC derived from wild type and JNK1–/– were conducted for the indicated times, and cell numbers were assessed by evaluation of total DNA content. (B) Wild-type and JNK1–/– cells established tight junctions, as shown by scanning electron microscopy. (C) Wild-type and JNK1–/– MTEC maintained in ALI for 10 days in the presence of 30 nM retinoic acid produced mucin. Media from two independent cultures from each condition were analyzed by slot blot analysis, using an anti-mucin antibody. Different dots shown represent results from independent samples.
Fig. 6
Fig. 6
TGF-β1 induces EMT transcriptional responses in MTEC in a JNK1-dependent manner. (A) TGF-β1-induced gene expression changes obtained via microarray analysis are blunted in JNK1 MTEC compared with wild-type cells. Data plot shows the fold change (2n) in gene expression induced by TGF-β1 compared to sham controls (TGF-β1-treated, sham controls) for wild-type MTEC (x-axis) and JNK1–/– MTEC (y-axis). The dashed line depicts the normal distribution expected if the gene expression changes were similar in wild-type and JNK1–/– MTEC. The solid line depicts the mean gene expression changes observed, and indicate a blunted response to TGF-β1 in JNK1–/– MTEC. Horizontal and vertical gray dotted lines represent the twofold change cutoffs. (B) TGF-β1-dependent modulation of mesenchymal and epithelial gene expression in MTEC depends on JNK-1. MTEC were treated with 5 ng/ml TGF-β1 for the indicated times and RNA evaluated by Taqman analysis. Data are represented as fold change in expression compared to sham controls (n=2, representative of five independent experiments). (C) TGF-β1 enhanced expression of known EMT regulatory transcription factors in a JNK1-dependent manner as assessed by Taqman analysis. * P<0.05, ANOVA versus wild-type MTEC. CCSP, clara cell secretory protein; Col1a1, collagen type 1a1; Fn1, fibronectin 1; HMGA 2, high mobility group AT-hook 2; Jag-1, jagged-1; PAI-1, plasminogen activator inhibitor 1.
Fig. 7
Fig. 7
Evaluation of TGF-β1 pathway activation in wild-type and JNK1–/–-deficient MTEC. (A) Assessment of nuclear accumulation of phospho-Smad2 (P-Smad2), Smad2, P-Smad3, Smad3, Smad4 and P-Jun in wild-type or JNK1–/– MTEC after exposure to 5 ng/ml TGF-β1 for 120 or 240 minutes. (B) Assessment of binding of nuclear proteins to the consensus SBE via electrophoretic mobility shift analysis in wild-type or JNK1–/– MTEC after exposure to 5 ng/ml TGF-β1 for 120 or 240 minutes. Different lanes shown represent results from independent samples.

References

    1. Bolstad BM, Irizarry RA, Astrand M, Speed TP. A comparison of normalization methods for high density oligonucleotide array data based on variance and bias. Bioinformatics. 2003;19:185–193. - PubMed
    1. Camon E, Magrane M, Barrell D, Binns D, Fleischmann W, Kersey P, Mulder N, Oinn T, Maslen J, Cox A, et al. The Gene Ontology Annotation (GOA) project: implementation of GO in SWISS-PROT, TrEMBL, and InterPro. Genome Res. 2003;13:662–672. - PMC - PubMed
    1. Davis RJ. Signal transduction by the JNK group of MAP kinases. Cell. 2000;103:239–252. - PubMed
    1. Dennler S, Prunier C, Ferrand N, Gauthier JM, Atfi A. c-Jun inhibits transforming growth factor beta-mediated transcription by repressing Smad3 transcriptional activity. J. Biol. Chem. 2000;275:28858–28865. - PubMed
    1. Derynck R, Zhang YE. Smad-dependent and Smad-independent pathways in TGF-beta family signalling. Nature. 2003;425:577–584. - PubMed

Publication types

MeSH terms

Substances