. 2008 Mar 18;105(11):4197-202.
doi: 10.1073/pnas.0708921105. Epub 2008 Mar 11.

A rapid upward shift of a forest ecotone during 40 years of warming in the Green Mountains of Vermont

Affiliations

A rapid upward shift of a forest ecotone during 40 years of warming in the Green Mountains of Vermont

Brian Beckage et al. Proc Natl Acad Sci U S A. .

Abstract

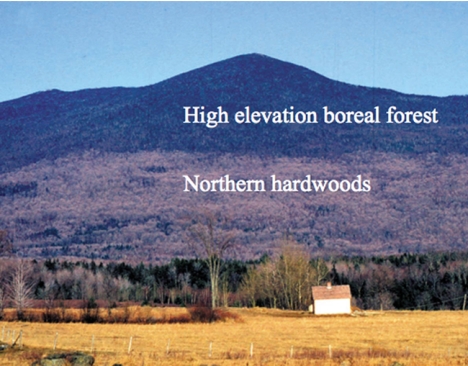
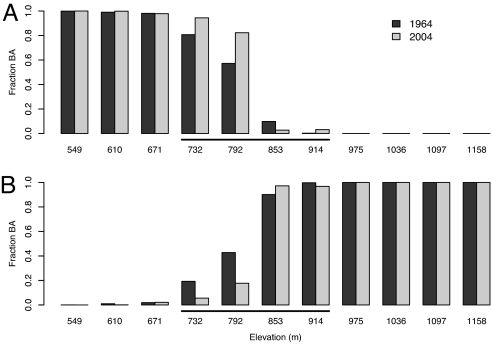
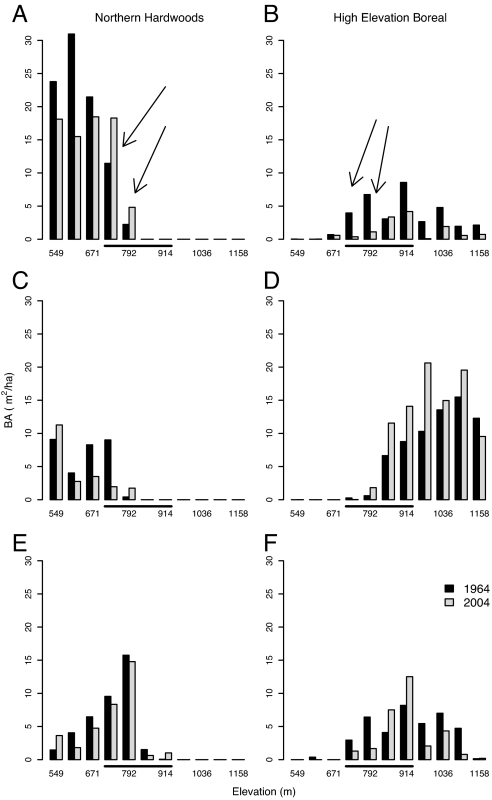
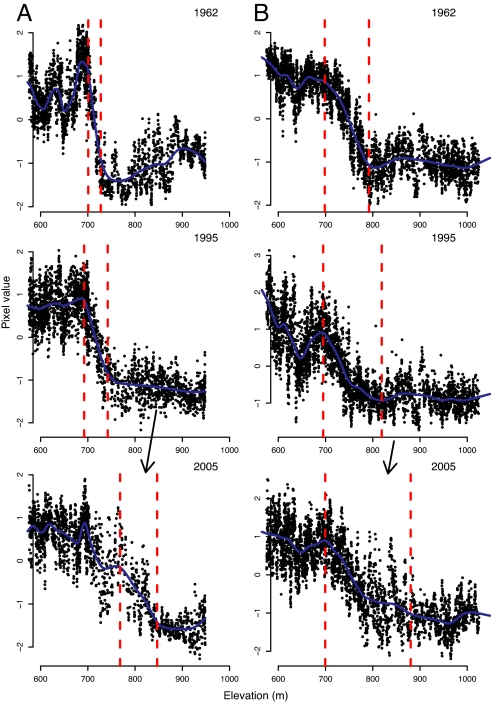
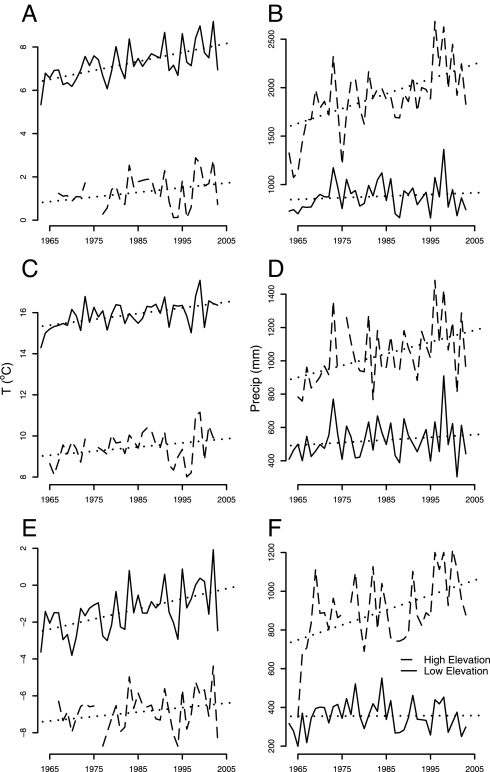
Detecting latitudinal range shifts of forest trees in response to recent climate change is difficult because of slow demographic rates and limited dispersal but may be facilitated by spatially compressed climatic zones along elevation gradients in montane environments. We resurveyed forest plots established in 1964 along elevation transects in the Green Mountains (Vermont) to examine whether a shift had occurred in the location of the northern hardwood-boreal forest ecotone (NBE) from 1964 to 2004. We found a 19% increase in dominance of northern hardwoods from 70% in 1964 to 89% in 2004 in the lower half of the NBE. This shift was driven by a decrease (up to 76%) in boreal and increase (up to 16%) in northern hardwood basal area within the lower portions of the ecotone. We used aerial photographs and satellite imagery to estimate a 91- to 119-m upslope shift in the upper limits of the NBE from 1962 to 2005. The upward shift is consistent with regional climatic change during the same period; interpolating climate data to the NBE showed a 1.1 degrees C increase in annual temperature, which would predict a 208-m upslope movement of the ecotone, along with a 34% increase in precipitation. The rapid upward movement of the NBE indicates little inertia to climatically induced range shifts in montane forests; the upslope shift may have been accelerated by high turnover in canopy trees that provided opportunities for ingrowth of lower elevation species. Our results indicate that high-elevation forests may be jeopardized by climate change sooner than anticipated.


Conflict of interest statement

The authors declare no conflict of interest.

Figures

Fig. 1.
Fig. 1.
The distinct zonation of northern hardwood and boreal forests with elevation on Mount Abraham in the Green Mountains of Vermont. [Reproduced with permission from ref. (Copyright 2003, American Meteorological Society).]
Fig. 2.
Fig. 2.
Relative composition of forest stands (as fraction of basal area) by northern hardwood (A) and boreal (B) tree species by elevation in 1964 and 2004. These data were collected along elevational transects on three mountains: Bolton Mountain, Camels Hump, and Mount Abraham. The elevational range of the ecotone is indicated by the underscoring. The boreal fraction of forest stands at the two lower elevations of the ecotone decreased from 19% to 6% at 732 m and from 43% to 18% at 792 m, and the deciduous fraction increased from 81% to 94% at 732 m and from 57% to 82% at 792 m.
Fig. 3.
Fig. 3.
Basal area of dominant tree species of northern hardwood (A, C, and E) and boreal (B, D, and F) forests by elevation for 1964 and 2004. Sugar maple (A), red spruce (B), American beech (C), balsam fir (D), yellow birch (E), and paper birch (F). The elevational range of the ecotone is indicated by the underscoring. The shift in the ecotone has been driven both by increases in northern hardwood species at their upper elevation limit (e.g., A, arrows) and decreases in boreal species at their lower limits (e.g., B, arrows).
Fig. 4.
Fig. 4.
Upslope shift of the ecotone between northern hardwood and boreal forest. The location of the ecotone is shown in 1962, 1995, and 2005 for Camels Hump (A) and Mount Abraham (B). The black points represent the normalized pixel values (z scores) from aerial photographs or satellite images for pixels along narrow transects that cross from northern hardwood to boreal forest. Higher pixel values are indicative of northern hardwood forests. Identical transects were examined in all 3 years for each mountain. The blue line represents the smoothed model fit to these data, and the red dashed lines represent the estimated change-point locations, which delineate the ecotone. The arrows in the 2005 graphs indicate elevations where northern hardwood species have moved into former areas of boreal forest.
Fig. 5.
Fig. 5.
Temperature and precipitation at Burlington International Airport (“low elevation”; solid curves) and the summit of Mount Mansfield (“high elevation”; dashed curves) for the period from 1963 to 2003. (A) Monthly mean temperature smoothed with a 12-month running mean. (B) Total annual precipitation. (C) Growing season (April–September) mean temperature. (D) Total growing season (April–September) precipitation. (E) Winter (October–March) mean temperature. (F) Total winter (October–March) precipitation. Precipitation is reported in rainfall equivalent. The dotted lines represent least-squares fitted lines.

References

    1. Mann ME, Bradley RS, Hughes MK. Nature. 1998;392:779–787.
    1. Easterling DR, Evans JL, Groisman PY, Karl TR, Kunkel KE, Ambenje P. Bull Am Meteorol Soc. 2000;81:417–425.
    1. Stott PA, Tett SFB, Jones GS, Allen MR, Mitchell JFB, Jenkins GJ. Science. 2000;290:2133–2137. - PubMed
    1. Karl TR, Trenberth KE. Science. 2003;302:1719–1723. - PubMed
    1. Hansen J, Nazarenko L, Ruedy R, Sato M, Willis J, Del Genio A, Koch D, Lacis A, Lo K, Menon S, et al. Science. 2005;308:1431–1435. - PubMed

Publication types

LinkOut - more resources