. 2008 May 15;111(10):4934-43.
doi: 10.1182/blood-2007-10-116145. Epub 2008 Mar 11.

Heparanase regulates retention and proliferation of primitive Sca-1+/c-Kit+/Lin- cells via modulation of the bone marrow microenvironment

Affiliations

Heparanase regulates retention and proliferation of primitive Sca-1+/c-Kit+/Lin- cells via modulation of the bone marrow microenvironment

Asaf Spiegel et al. Blood. .

Abstract

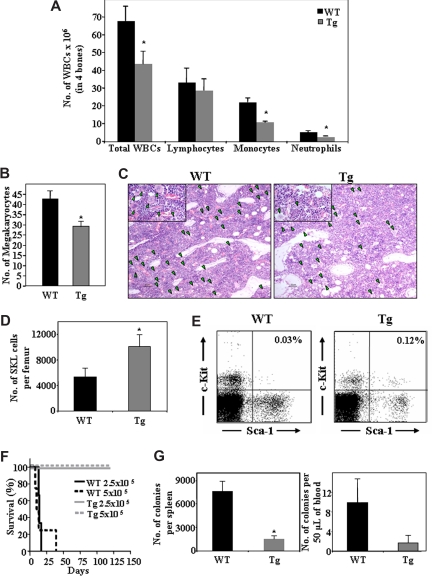
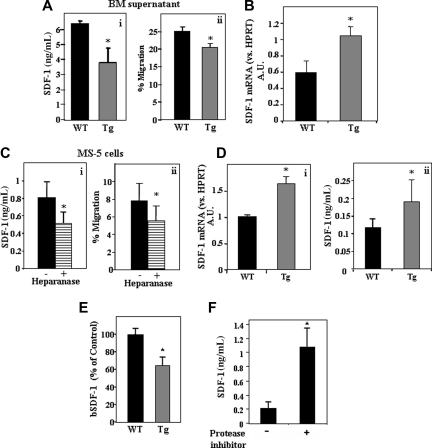
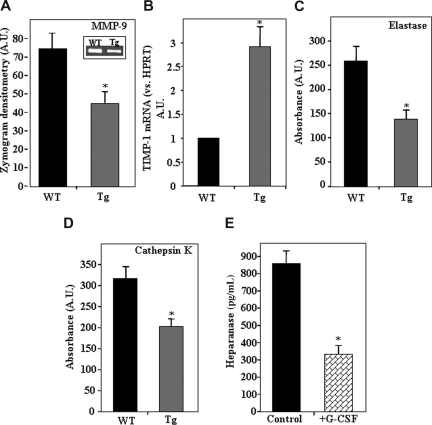
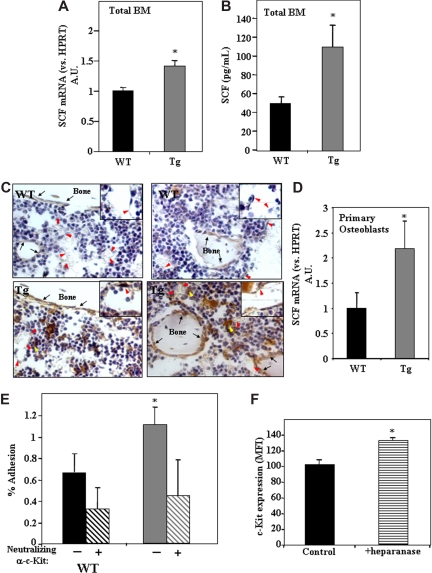
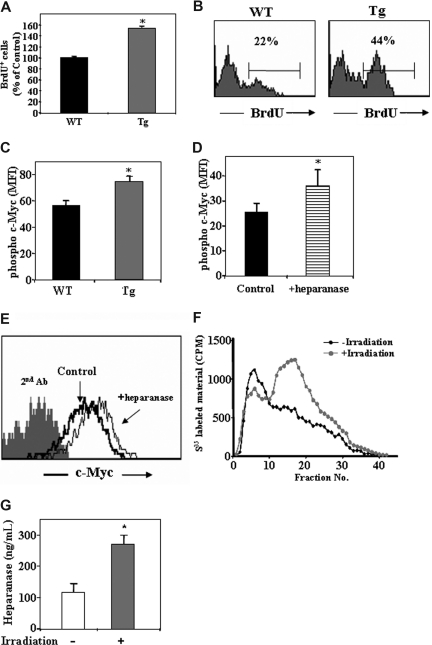
Heparanase is involved in tumor growth and metastasis. Because of its unique cleavage of heparan sulfate, which binds cytokines, chemokines and proteases, we hypothesized that heparanase is also involved in regulation of early stages of hematopoiesis. We report reduced numbers of maturing leukocytes but elevated levels of undifferentiated Sca-1(+)/c-Kit(+)/Lin(-) cells in the bone marrow (BM) of mice overexpressing heparanase (hpa-Tg). This resulted from increased proliferation and retention of the primitive cells in the BM microenvironment, manifested in increased SDF-1 turnover. Furthermore, heparanase overexpression in mice was accompanied by reduced protease activity of MMP-9, elastase, and cathepsin K, which regulate stem and progenitor cell mobilization. Moreover, increased retention of the progenitor cells also resulted from up-regulated levels of stem cell factor (SCF) in the BM, in particular in the stem cell-rich endosteum and endothelial regions. Increased SCF-induced adhesion of primitive Sca-1(+)/c-Kit(+)/Lin(-) cells to osteoblasts was also the result of elevation of the receptor c-Kit. Regulation of these phenomena is mediated by hyperphosphorylation of c-Myc in hematopoietic progenitors of hpa-Tg mice or after exogenous heparanase addition to wildtype BM cells in vitro. Altogether, our data suggest that heparanase modification of the BM microenvironment regulates the retention and proliferation of hematopoietic progenitor cells.


Figures

Figure 1
Figure 1
Heparanase overexpression alters hematopoietic development and leads to increased retention of stem cells in the BM. Cells were flushed from the BM of wildtype (WT) or hpa-Tg (Tg) mice. (A) The number of WBC, lymphocytes, monocytes, and neutrophils in 4 bones was assessed. Data are means plus or minus SE; n ≥ 10 mice. (B) Number of megakaryocytes in bone sections of WT or hpa-Tg mice, determined by counting of 9 random fields per bone section. Data are means plus or minus SE; n = 3 mice, 2 bone sections per mouse. (C) Representative figure showing hematoxylin and eosin staining of femoral bone in WT and hpa-Tg mice (original magnification ×10). Inset: original magnification ×40. Green arrowheads point at megakaryocytes. Micrographs were acquired by staining with H&E, viewed with a light microscope (Eclipse E800M) fitted with a 10×/Plan-Apoobjective, and photographed with a digital camera (DXm1200), and image acquisition software (ACT-1, v. 2.63, all from Nikon, Tokyo, Japan). Images were processed by Adobe Photoshop, v. 7.0 (San Jose, CA). (D) Number of primitive undifferentiated Sca-1+/c-Kit+/Lin cells in one femur of WT or hpa-Tg mice, as counted by flow cytometry. Data are means plus or minus SE; n = 7 mice. (E) A representative dot plot of Sca-1+/c-Kit+ (gated from Lin population) derived from the BM of WT or hpa-Tg mice (F) Survival of lethally irradiated C57/BL6 mice injected with the indicated number of BM cells from WT or hpa-Tg donors. (G) Number of progenitor cells in the peripheral blood and spleen of WT and hpa-Tg mice, determined by colony assay. Data are means plus or minus SE; n ≥ 4 mice (*P < .05).
Figure 2
Figure 2
Heparanase increases SDF-1 turnover in the BM.(A) SDF-1 levels in the BM of WT or hpa-Tg mice, detected by ELISA (i). Migration of cord blood CD34+ cells toward RPMI supplemented with supernatant from BM of WT or hpa-Tg mice placed in the lower chamber (ii). Data are means plus or minus SE; n ≥ 9 samples of BM supernatants. (B) mRNA levels of SDF-1 in BM cells from WT or hpa-Tg mice. Data are means plus or minus SE; n ≥ 4. (C) SDF-1 levels in the conditioned medium of MS-5 cells with or without pretreatment of the cells with heparanase, detected by ELISA (i). Migration of cord blood CD34+ cells toward the conditioned medium of MS-5 cells placed in the lower chamber of a transwell (ii). Data are means plus or minus SE; n ≥ 10 samples of conditioned medium. (D) (i) mRNA levels of SDF-1 (vs HPRT) in osteoblasts from WT or hpa-Tg mice. Data are means plus or minus SE; n ≥ 4. (ii) SDF-1 levels in the conditioned medium of osteoblasts obtained from WT or hpa-Tg mice, detected by ELISA. Data are mean plus or minus SE; n = 9. (E) Levels of biotinylated SDF-1 added exogenously to the BM supernatant of WT or hpa-Tg mice, detected by ELISA. Data are means plus or minus SE; n ≥ 8 samples of BM supernatants. (F) Levels of biotinylated SDF-1 added exogenously to the BM supernatant of hpa-Tg mice with or without pretreatment with a broad range protease inhibitor, detected by ELISA. Data are means plus or minus SE; n = 3 samples of BM supernatants (*P < .05).
Figure 3
Figure 3
Decreased protease activity resulting from heparanase overexpression.(A) Average levels of MMP-9 activity in the BM supernatant of WT (control) and hpa-Tg mice. Inset shows a representative gelatin zymography experiment. Data are means plus or minus SE; n = 6 samples. (B) mRNA levels of TIMP-1 in BM cells from WT or hpa-Tg mice. Data are means plus or minus SE; n = 3. (C) Levels of elastase activity in the BM supernatant of WT and hpa-Tg mice. Average absorbance (arbitrary units) is shown. Data are means plus or minus SE; n = 6 samples. (D) Levels of cathepsin K activity in the BM supernatant of WT and hpa-Tg mice. Average absorbance (arbitrary units) is shown. Data are means plus or minus SE; n = 12 samples. (E) Heparanase levels in BM supernatant of mice treated with G-CSF (compared with control nontreated mice), determined by ELISA. Data are means plus or minus SE; n = 3 mice (*P < .05).
Figure 4
Figure 4
Increased levels of SCF in the BM of hpa-Tg mice stimulate adhesion of primitive cells to osteoblasts.(A) SCF mRNA levels in BM cells from WT or hpa-Tg mice, detected by real-time RT-PCR. Data are means plus or minus SE; n = 9 samples. (B) SCF levels in the BM of WT or hpa-Tg mice, detected by ELISA. Data are means plus or minus SE; n = 5 samples. (C) SCF staining (brown) of femoral bone from WT or hpa-Tg mice. Inset shows enlargement of sinusoidal endothelial region. Black arrows point at bone lining osteoblasts. Red arrowheads point at endothelial cells. Yellow arrowheads point at cells that highly express SCF and are in close proximity to sinusoids. Micrographs were acquired by staining with goat anti–mouse stem cell factor (R&D systems) and processed as in Figure 1C, except with a 40×/Plan-Apo objective. (D) mRNA levels of SCF in primary osteoblasts derived from WT or hpa-Tg mice. Data are means plus or minus SE; n = 4 experiments. (E) Percentage adhesion to primary osteoblasts of BM MNC Sca-1+/c-Kit+/Lin cells derived from hpa-Tg compared with control (WT) mice. In some experiments, leukocytes were pretreated with neutralizing anti-c-Kit antibodies before adhesion. Data are means plus or minus SE; n ≥ 4 experiments. (F) c-Kit receptor expression in the primitive c-Kit+/Lin cells following exogenous in vitro treatment with heparanase. Data are means plus or minus SE; n = 3 experiments (*P < .05).
Figure 5
Figure 5
Heparanase is involved in progenitor cell proliferation.(A) BrdU uptake in the primitive c-Kit+/Lin cells obtained from control WT or hpa-Tg mice, as detected by flow cytometry. Data are means plus or minus SE; n = 4 samples. (B) Representative histogram plot of BrdU+ cells among the c-Kit+/Lin population obtained from WT or hpa-Tg mice. (C) Phosphorylated c-Myc expression in the primitive cKit+/Lin BM cells obtained from the BM of WT or hpa-Tg mice. (D) Phosphorylated c-Myc expression in the primitive c-Kit+/Lin cells following exogenous in vitro treatment with heparanase (compared with control nontreated cells). Data are means plus or minus SE; n = 3 samples. (E) Representative histogram plot of phosphorylated c-Myc expression levels among the primitive c-Kit+/Lin cells following in vitro treatment with or without exogenous heparanase. (F) Heparanase activity (determined by the ability to degrade sulfate-labeled heparan-sulfate) in lysates of cells collected from the BM of irradiated (24 hours after irradiation) or nonirradiated mice. Data are means plus or minus SE; n = 3 mice. (G) Heparanase levels in BM supernatant of WT and hpa-Tg mice as determined by ELISA. Data are means plus or minus SE; n = 7 mice (*P < .05).

References

    1. Papayannopoulou T. Current mechanistic scenarios in hematopoietic stem/progenitor cell mobilization. Blood. 2004;103:1580–1585. - PubMed
    1. Suda T, Arai F, Hirao A. Hematopoietic stem cells and their niche. Trends Immunol. 2005;26:426–433. - PubMed
    1. Taichman RS. Blood and bone: two tissues whose fates are intertwined to create the hematopoietic stem-cell niche. Blood. 2005;105:2631–2639. - PubMed
    1. Weissman IL. Translating stem and progenitor cell biology to the clinic: barriers and opportunities. Science. 2000;287:1442–1446. - PubMed
    1. Adams GB, Scadden DT. The hematopoietic stem cell in its place. Nat Immunol. 2006;7:333–337. - PubMed

Publication types