An official website of the United States government
The .gov means it’s official.
Federal government websites often end in .gov or .mil. Before
sharing sensitive information, make sure you’re on a federal
government site.
The site is secure.
The https:// ensures that you are connecting to the
official website and that any information you provide is encrypted
and transmitted securely.
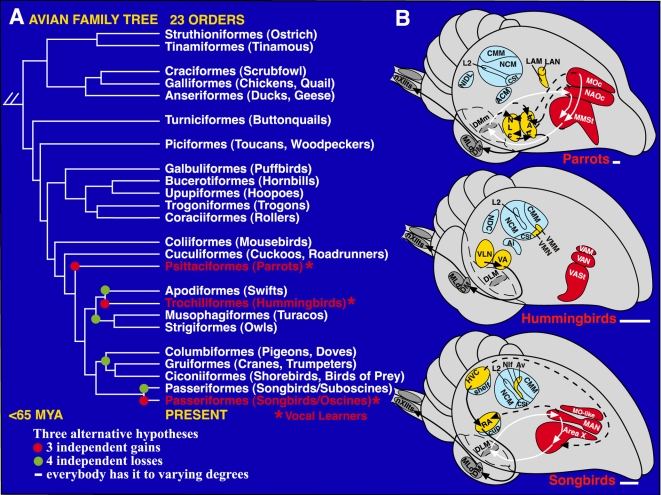
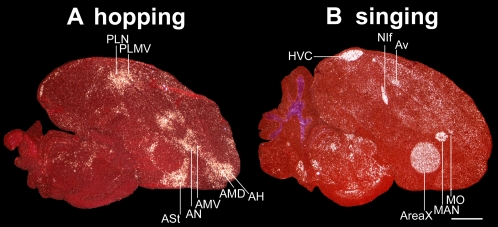
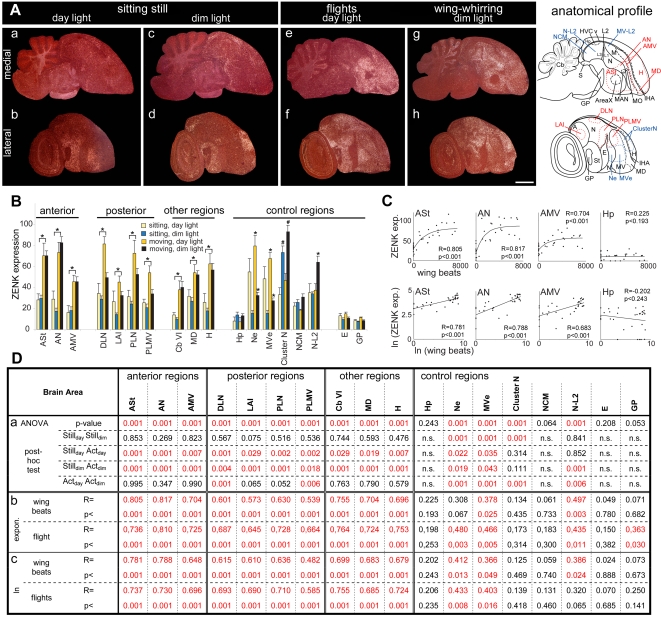
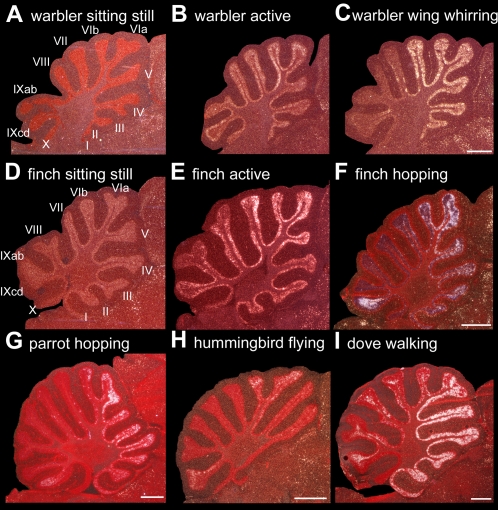
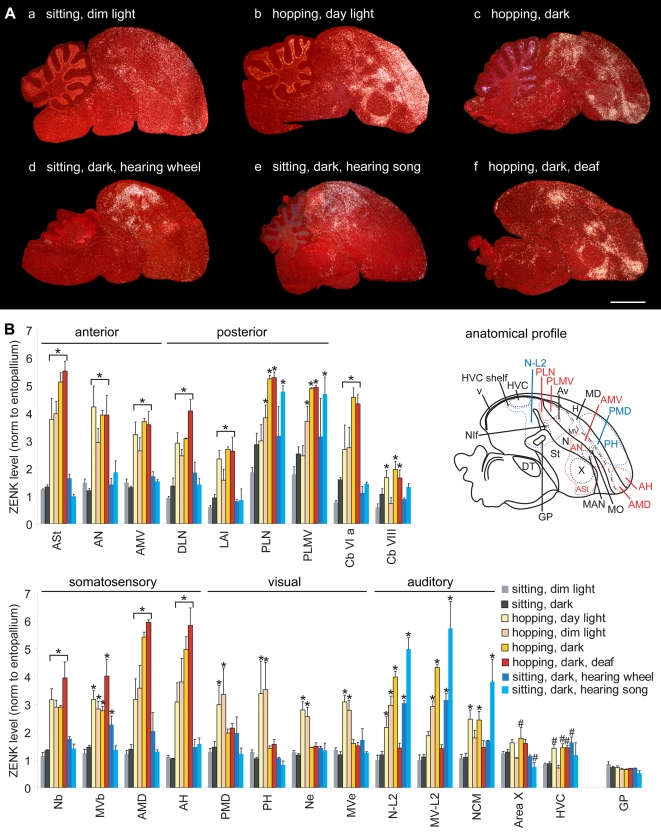
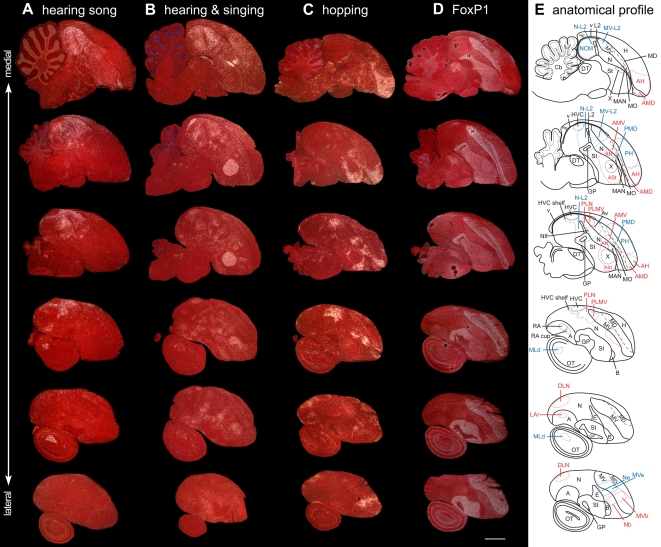
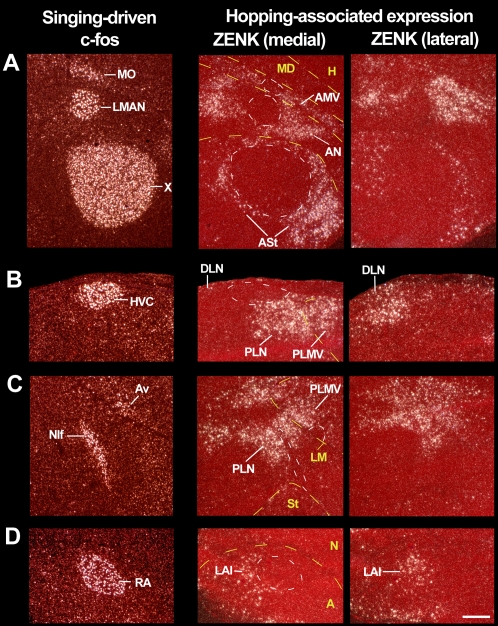
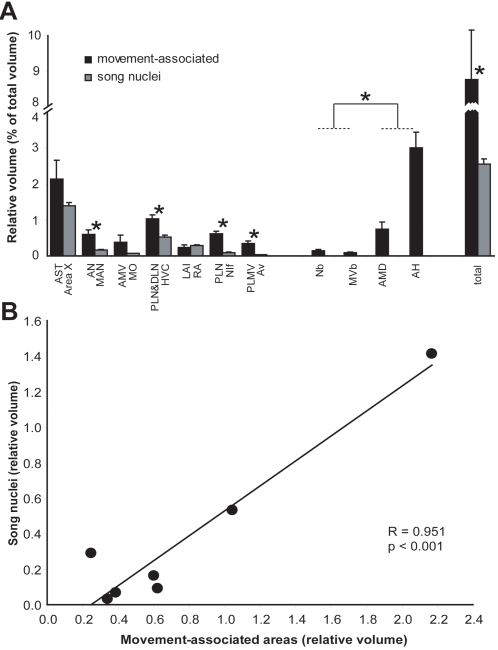
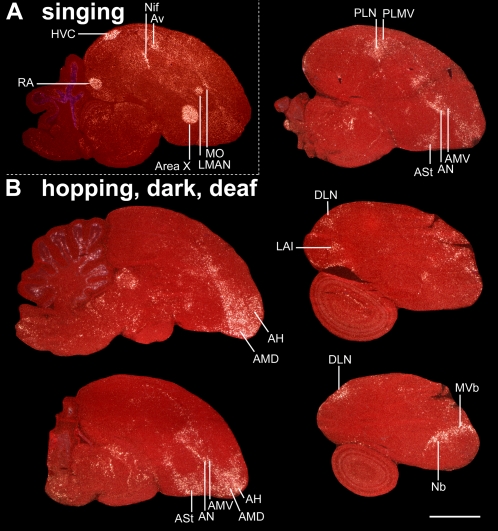
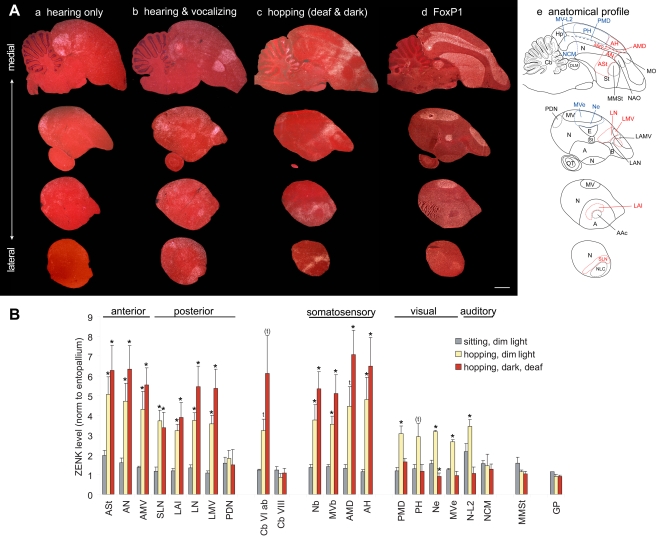
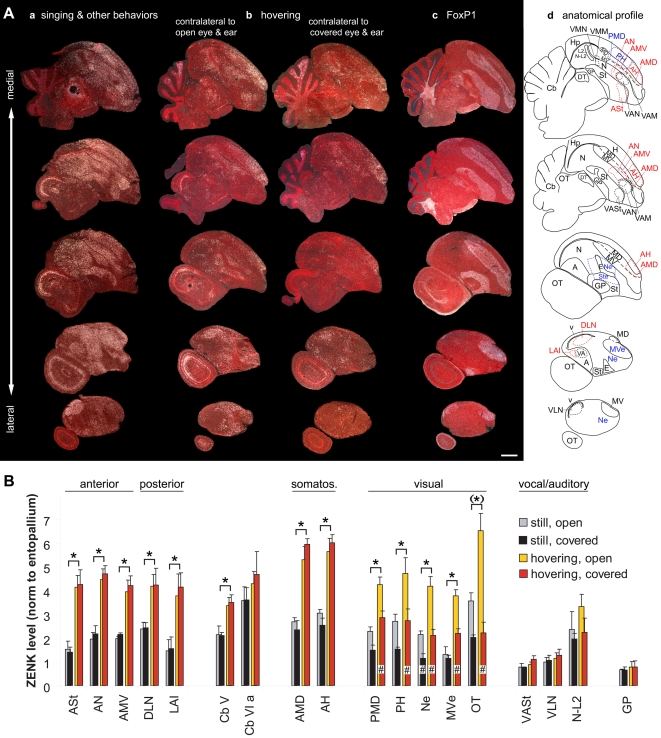
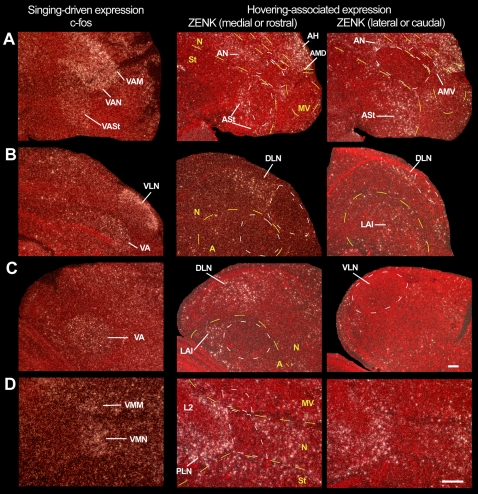
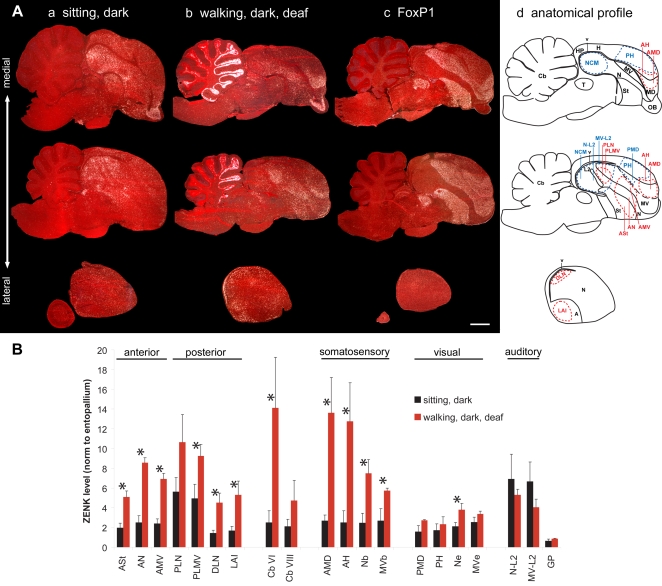
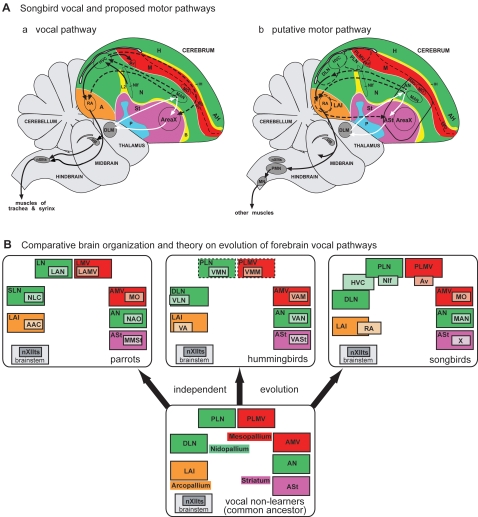
Vocal learning is a critical behavioral substrate for spoken human language. It is a rare trait found in three distantly related groups of birds-songbirds, hummingbirds, and parrots. These avian groups have remarkably similar systems of cerebral vocal nuclei for the control of learned vocalizations that are not found in their more closely related vocal non-learning relatives. These findings led to the hypothesis that brain pathways for vocal learning in different groups evolved independently from a common ancestor but under pre-existing constraints. Here, we suggest one constraint, a pre-existing system for movement control. Using behavioral molecular mapping, we discovered that in songbirds, parrots, and hummingbirds, all cerebral vocal learning nuclei are adjacent to discrete brain areas active during limb and body movements. Similar to the relationships between vocal nuclei activation and singing, activation in the adjacent areas correlated with the amount of movement performed and was independent of auditory and visual input. These same movement-associated brain areas were also present in female songbirds that do not learn vocalizations and have atrophied cerebral vocal nuclei, and in ring doves that are vocal non-learners and do not have cerebral vocal nuclei. A compilation of previous neural tracing experiments in songbirds suggests that the movement-associated areas are connected in a network that is in parallel with the adjacent vocal learning system. This study is the first global mapping that we are aware for movement-associated areas of the avian cerebrum and it indicates that brain systems that control vocal learning in distantly related birds are directly adjacent to brain systems involved in movement control. Based upon these findings, we propose a motor theory for the origin of vocal learning, this being that the brain areas specialized for vocal learning in vocal learners evolved as a specialization of a pre-existing motor pathway that controls movement.
Competing Interests: The authors have declared that no competing interests exist.
Figures
Figure 1. Phylogenetic and brain relationships of…
Figure 1. Phylogenetic and brain relationships of avian vocal learners.
A. One view of the…
Figure 1. Phylogenetic and brain relationships of avian vocal learners.
A. One view of the phylogenetic relationships of living birds . Vocal learners are highlighted in red. Red dots: possible independent gains of vocal learning; green dots: alternatively, possible independent losses. B. Semi-3D view of seven cerebral vocal nuclei (red and yellow) found in vocal learners and of auditory areas (blue) found in all birds. Red-labeled vocal nuclei and white arrows: anterior vocal pathway. Yellow-labeled vocal nuclei and black arrows: posterior vocal pathway. Only a few connections in hummingbirds are known and that of songbird MO is not known. Based on serial sections of singing-driven IEG expression in this study, we see that NIf and Av are adjacent at lateral levels. Anterior is right, dorsal is up. Scale bars, 1 mm. Figure modified from Jarvis et al. (2000) and Jarvis (2004) , with connectivity reviewed therein.
Figure 2. IEG expression patterns in brain…
Figure 2. IEG expression patterns in brain sections from moving versus singing zebra finches.
A.…
Figure 2. IEG expression patterns in brain sections from moving versus singing zebra finches.
A. Example of the most restricted movement-associated expression pattern obtained in this study. A mid-sagittal section from a deafened bird that was hopping in the dark. B. Comparable section from a bird that was singing while movingly relatively little. ZENK expression is shown in (A); c-fos is shown in (B) due to its high contrast in vocal nuclei. White: IEG expression; red: cresyl violet staining. Six (HVC, NIf, Av, Area X, MAN, and MO) of the seven vocal nuclei can be seen in these sections, which are adjacent to five movement-associated areas (PLN, PLMV, ASt, AN, AMV); movement-associated areas laterally adjacent to the HVC and RA are not in this section. AMD and AH are known somatosensory areas. Anterior is right, dorsal is up. Scale bar, 2 mm.
Figure 3. Movement-induced ZENK expression in garden…
Figure 3. Movement-induced ZENK expression in garden warblers.
A. Darkfield images of medial (top) and…
Figure 3. Movement-induced ZENK expression in garden warblers.
A. Darkfield images of medial (top) and lateral (bottom row) sagittal sections from birds sitting relatively still in room day light (a, b) or dim night light (c, d) and birds making mostly flights in day light (e, f) or wing whirring in dim light (g, h). The anatomical profiles to the right show the extent of the movement-induced (red) and visual-induced (blue) gene expression areas. Note that the PLN and PLMV areas differ slightly in shape between garden warblers (panel Af,h) and zebra finches (Fig. 2A), due to differences in the shapes of the N and MV cerebral subdivisions and that the warbler sections are more lateral. Anterior is right, dorsal is up. Scale bar, 2 mm. B. Quantification of ZENK expression levels in different brain areas from the four groups of warblers. Anterior and posterior areas were grouped according to their relative location to vocal nuclei. * = p<0.05, one-way ANOVA followed by Holm-Sidak multi-comparison test, comparing moving groups with still groups for each light condition; each movement group showed significant differences with each still group. # = p<0.001 for an increase in Cluster N in dim versus day light groups, whether still or moving. Error bars, S.E.M. C. Correlation between the amount of wing beats and ZENK expression levels shown in exponential (top row) and double natural logarithmic (bottom row) graphs for example areas. Each dot represents the value of one bird. D. Statistical analyses: (a) one-way ANOVA followed by Holm-Sidak all-pairwise multi-comparison test for the brain areas in (B); (b) exponential regression stats (examples in C, top row); (c) linear regression stats on double-logarithmic transformation of the data (C, bottom row). Red text are significant differences (p<0.05); n.s. = not significant.
Figure 4. Movement-induced ZENK expression in the…
Figure 4. Movement-induced ZENK expression in the cerebellum.
Example sagittal sections of: A. Garden warbler…
Figure 4. Movement-induced ZENK expression in the cerebellum.
Example sagittal sections of: A. Garden warbler sitting still. B. Garden warbler making flights and other movements in day light. C. Garden warbler performing wing whirring in dim light. D. Zebra finch sitting still. E. Zebra finch flying and hopping around the perimeter of the cylinder cage. F. Zebra finch hopping in a rotating wheel. G. Budgerigar hopping in the wheel. H. Anna's hummingbird hovering. I. Ring dove walking on a treadmill. Birds in G and I were deaf; F, G, and I were in the dark. Anterior is right, dorsal is up. Scale bar, 1 mm.
Figure 5. Movement-induced ZENK expression in zebra…
Figure 5. Movement-induced ZENK expression in zebra finches.
A. Sagittal sections of birds (a) sitting…
Figure 5. Movement-induced ZENK expression in zebra finches.
A. Sagittal sections of birds (a) sitting relatively still in dim light, (b) hopping around the perimeter of a cylindrical cage in day light, (c) hopping in a rotating wheel in the dark, (d) sitting still in the dark and hearing a bird hop in the rotating wheel, (e) sitting still in the dark and hearing playbacks of zebra finch song, and (f) hopping in the rotating wheel in the dark while deaf. The anatomical profile in the lower right highlights the extent of the movement-induced (red) and visual- and auditory-induced (blue) gene expression. Anterior is right, dorsal is up. Scale bar, 2 mm. B. Quantification of ZENK expression levels in 23 brain regions in 8 groups of male zebra finches. Except for a small difference in cerebellum lobule VI, there were no significant differences between sitting still dim light and dark animals; thus, they were treated as one control group for statistical analysis. * = p<0.05 to<0.0001, one-way ANOVA followed by Holm-Sidak multi-comparison test relative to combined values of sitting still animals in dim light+dark (n = 3–6/group). Lines underneath *s indicate brain areas with statistically significant increases exclusive to the moving groups. #s alone indicate values that approached significance by a few tenths of decimal in the ANOVA test. Error bars, S.E.M.
Figure 6. Serial sagittal brain sections of…
Figure 6. Serial sagittal brain sections of ZENK expression in male zebra finches.
A. Auditory…
Figure 6. Serial sagittal brain sections of ZENK expression in male zebra finches.
A. Auditory areas: bird sitting still in the dark while hearing song. Although not mentioned in the main text, hearing-induced expression also occurs in caudal St and MLd, known auditory regions of the striatum and midbrain, respectively . B. Auditory and vocal areas: bird hearing and singing alone in a sound box in the day light condition. C. Movement areas: bird hopping in the rotating wheel in the dark while deaf. D. FoxP1 expression from adjacent sections of the bird in (C). E. Corresponding anatomical drawings; red: areas with movement-induced expression; blue: areas with auditory- or visual-induced expression. First row are medial-most sections. Anterior is right, dorsal is up. Scale bar, 2 mm. Compare with frontal sections in figure S3.
Figure 7. High power images of IEG…
Figure 7. High power images of IEG activation in zebra finch vocal nuclei during singing…
Figure 7. High power images of IEG activation in zebra finch vocal nuclei during singing and in adjacent movement-associated areas during hopping.
(A) Anterior vocal nuclei adjacent to ASt, AN, and AMV. (B) HVC adjacent to DLN and dorsal PLN. (C) NIf and Av adjacent to ventral PLN and PLMV respectively. (D) RA adjacent to LAI. The c-fos expression in vocal nuclei (first column) is of a young zebra finch male that sang for 30 min while moving relatively little; c-fos is shown for its high contrast in vocal nuclei relative to the surrounding non-vocal areas. The hopping-associated expression (left two columns) is from a male that hoped in the dark and was deaf; the left most sections are lateral to the vocal nuclei (except for anterior areas, which still contain the lateral part of the anterior vocal nuclei). Yellow dashed lines-brain subdivision boundaries; white dashed lines–vocal nuclei boundaries, only highlighted for some images so that other sections can be viewed as is. Anterior is right, dorsal is up–sagittal sections; sections of the top panel are orientated at a ∼45° angle so that all three anterior vocal nuclei fit vertically into one image. Scale bar, 200 µm.
Figure 8. Relative volumes of movement-associated areas…
Figure 8. Relative volumes of movement-associated areas and vocal nuclei.
A. Relative volumes as a…
Figure 8. Relative volumes of movement-associated areas and vocal nuclei.
A. Relative volumes as a percentage of the summed cerebral (telencephalon) volume from a series of sagittal sections (see methods) from the hopping, dark and deaf animals. The movement-associated areas and adjacent vocal nuclei are shown as bars adjacent to each other. Totals represent the summed relative volumes of all movement-associated areas whether or not it is adjacent to a vocal nucleus, and of all vocal nuclei. * = p<0.05, paired t-test (within bird comparisons, n = 3). Error bars, S.E.M. Although all animals had higher volumes of ASt and AMV relative to Area X and MO, the variance was large in the movement areas such that the volume difference did not reach significance. B. Correlation between relative volumes of movement-associated regions and adjacent vocal nuclei. Each dot represents the average values from the graph in (A).
Figure 9. Movement-induced c-fos expression in zebra…
Figure 9. Movement-induced c-fos expression in zebra finches.
A. Vocal areas: brain section containing all…
Figure 9. Movement-induced c-fos expression in zebra finches.
A. Vocal areas: brain section containing all seven cerebral vocal nuclei from a singing bird. B. Movement areas: serial sections from a hopping bird in the rotating wheel in the dark while deaf. The patterns are similar to that found with ZENK (Fig. 6C). See figure 6E for delineation of anatomical boundaries. Anterior is right, dorsal is up. Scale bar, 2 mm.
Figure 10. Movement-induced ZENK expression in budgerigars,…
Figure 10. Movement-induced ZENK expression in budgerigars, a parrot.
A. Serial sagittal sections of: (a)…
Figure 10. Movement-induced ZENK expression in budgerigars, a parrot.
A. Serial sagittal sections of: (a) Auditory areas: bird sitting relatively still while hearing playbacks of budgerigar warble song; (b) Auditory and vocal areas: perched bird hearing himself and producing warble song while alone and moving relatively little; (c) Movement areas: bird hopping in the rotating wheel in the dark while deaf; (d) FoxP1 expression from adjacent sections of the bird in (c); (e) Corresponding anatomical drawings; red: areas with movement-induced expression; blue: areas with auditory- or visual-induced expression. First row are medial-most sections. Sections with N-L2 are not shown. Anterior is right, dorsal is up. Scale bar, 2 mm. Compare with frontal sections in figure S6. B. Quantification of ZENK expression levels in 22 different brain regions in three groups of budgerigars. * = p<0.05 to<0.0001, one-way ANOVA followed by Holm-Sidak multi-comparison test relative to the sitting still group (n = 3/group). t = significantly different, p<0.05, by a t-test. (t) = 0.06
Figure 11. Movement-induced ZENK expression in male…
Figure 11. Movement-induced ZENK expression in male Anna's hummingbird.
A. Serial sagittal sections of: (a)…
Figure 11. Movement-induced ZENK expression in male Anna's hummingbird.
A. Serial sagittal sections of: (a) Vocal and other areas: ZENK expression in a bird that was singing interspersed with flying near an outdoor feeder in the morning (high expression in non-vocal areas is due to other behaviors, including flying and feeding); (b) Auditory, visual, and movement-associated areas: ZENK expression in control hemisphere (contralateral to open eye and ear) and experimental hemisphere (contralateral to covered eye and ear) of a bird hovering in a plexiglass cage in dim light; (c) FoxP1 expression from adjacent sections of the experimental hemisphere of the bird in (b); (d) Corresponding anatomical drawings; red: areas with movement-induced expression; blue: areas with visual- or auditory-induced expression (auditory areas also determined from a previous study [7]). First row are medial-most sections. Anterior is right, dorsal is up. Scale bar, 2 mm. Compare with coronal sections in figure S7. B. Quantification of ZENK expression levels in 18 different brain regions, in both hemispheres, in two groups of hummingbirds. * indicates brain areas with statistically significant increases in both experimental (covered) and control (open) hemispheres of hovering birds relative to the experimental and control hemispheres of the relatively still birds (p<0.05, one-tailed t-test, n = 3 relatively still and 4 hovering animals for both hemispheres). # indicates significantly less increase in the experimental hemisphere (p<0.05, paired t-test on experimental and control hemispheres within birds). The (*) for the OT indicates that this is the only visual area that did not show increased ZENK expression in the experimental hemisphere opposite the covered eye. Error bars, S.E.M.
Figure 12. High power images of IEG…
Figure 12. High power images of IEG activation in hummingbird vocal nuclei during singing and…
Figure 12. High power images of IEG activation in hummingbird vocal nuclei during singing and in adjacent movement-associated areas during hopping.
A. Anterior vocal nuclei adjacent to ASt, AN, and AMV in sagittal sections. B. DLN adjacent to VLN [and LAI to VA] in coronal sections. C. LAI adjacent to VA [and DLN to VLN] in sagittal sections. D. VMN [as well as VMM] adjacent to activated areas near L2 in sagittal sections. The c-fos expression in vocal nuclei (first column) is of male that sang for 30 min interspersed with flying and feeding; c-fos is shown for its high contrast in vocal nuclei relative to the surrounding non-vocal areas. The hovering-associated expression patterns (left two columns) are from the hemisphere opposite of the covered eye and ear of males that hovered in a plexiglass cage. Anterior is right, dorsal is up for sagittal sections; medial is left, dorsal is up for frontal sections. The left most sections are either lateral (A, C, and D) or caudal (B) to that shown in the middle column. Different background red color is due to different cresyl violet staining intensities. Note that similar to budgerigar MO and NAO (Fig. 10Ab and Fig. S6A), the two analogous hummingbird pallial anterior vocal nuclei (VAM and VAM) are very close such that the IEG expression does not distinguish the brain subdivision boundary well. Yellow dashed lines-brain subdivision boundaries; white dashed lines–vocal nuclei boundaries, only highlighted for some images so that other sections can be viewed as is; boundaries were determined from Nissl stain and adjacent sections hybridized with FoxP1 (Fig. 11Ac and Fig. S7C). Scale bars, 200 µm.
Figure 13. Movement-induced ZENK expression in ring…
Figure 13. Movement-induced ZENK expression in ring doves, a vocal non-learner.
A. Sagittal sections of:…
Figure 13. Movement-induced ZENK expression in ring doves, a vocal non-learner.
A. Sagittal sections of: (a) Dove sitting relatively still in the dark; (b) Dove walking on a treadmill in the dark while deaf; (c) FoxP1 expression from adjacent sections of the bird in (b); (d) Corresponding anatomical drawings; red: areas with movement-induced expression; blue: known auditory and visual areas. First row are medial-most sections. Front is right, dorsal is up. Scale bar, 2 mm. B. Quantification of ZENK expression levels in 20 different brain regions in two groups of ring doves. * = p<0.05 to<0.0001, one-tailed t-test, relative to sitting still animals (n = 3/group). Error bars, S.E.M.
Figure 14. Summary of the results of…
Figure 14. Summary of the results of this study and proposed theory.
A. Schematic drawing…
Figure 14. Summary of the results of this study and proposed theory.
A. Schematic drawing of the known vocal pathway in songbirds (a) and the putative adjacent non-vocal motor pathway in all birds (b). Movement-associated areas adjacent to the posterior vocal nuclei (HVC, RA, NIf, and Av) in (b) are drawn with dashed lines to indicate that they are lateral to the plane of the section shown. Lines and arrows in (b) are inferred from our compilation of the literature on tracers placed adjacent to the vocal nuclei (Table 3). White arrows: connectivity of anterior vocal pathway (a) and proposed adjacent anterior motor pathway (b). Black arrows: connectivity of posterior vocal pathway (a) and proposed adjacent posterior motor pathway (b). Not all known connections are shown; in particular, the anterior mesopallium connections have not been determined in songbirds, a DLN to ASt connection appears to be weak in zebra finches, and RA and LAI also projects to other sub-telencephalic areas (Table 3 and references therein), and connectivity of PLN and PLMV with other movement-associated regions is not known. Different background colors designate different cerebral brain subdivisions. B. Diagram comparing brain organization in the three vocal learning groups and in a vocal non-learner as a proposed common ancestor. We hypothesize that by independent evolution, the vocal nuclei (light colored boxes) of recent vocal learners originated from the movement-associated brain areas (dark colored boxes) of the common ancestor. Relative sizes and positions of brain areas are approximate. The parrot posterior regions (LAI, SLN, LAN, and LAMV) are more anterior and laterally than the corresponding areas in the other species. Hummingbird PLN and PLMV are highlighted with dashed lines to indicate that they were only examined in a few birds. Songbird HVC is drawn as adjacent to both DLN and PLN, and thus, it is ambiguous as to which region it could have evolved from. Color-coding in panel (B) reflects the coding of panel (A).
Janik VM, Slater PJB. Vocal learning in mammals. Adv Study Behav. 1997;26:59–99.
Sanvito S, Galimberti F, Miller EH. Observational Evidences of Vocal Learning in Southern Elephant Seals: A Longitudinal Study. Ethology. 2007;113:137–146.
Poole JH, Tyack PL, Stoeger-Horwath AS, Watwood S. Animal behaviour: Elephants are capable of vocal learning. Nature. 2005;434:455–456.
-
PubMed
Nottebohm F. The origins of vocal learning. Amer Natural. 1972;106:116–140.
Jarvis ED, Scharff C, Grossman MR, Ramos JA, Nottebohm F. For whom the bird sings: context-dependent gene expression. Neuron. 1998;21:775–788.
-
PubMed