

Analysis of human MDM4 variants in papillary thyroid carcinomas reveals new potential markers of cancer properties
- PMID: 18335186
- PMCID: PMC2359832
- DOI: 10.1007/s00109-008-0322-6
Analysis of human MDM4 variants in papillary thyroid carcinomas reveals new potential markers of cancer properties
Abstract
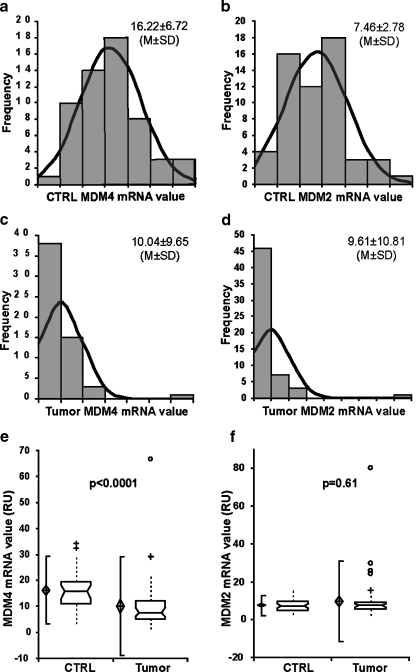
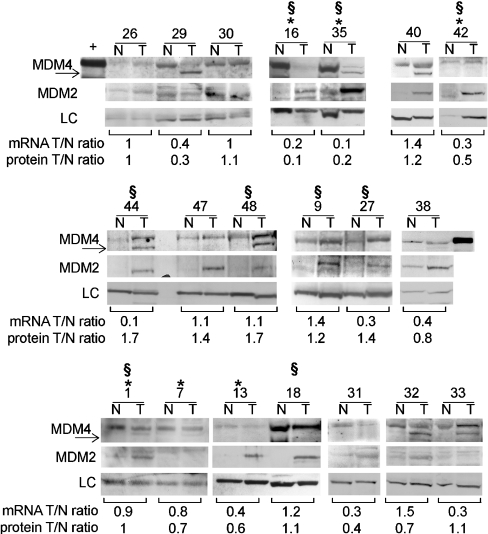
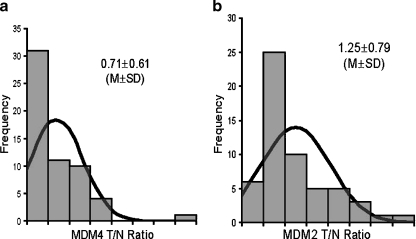
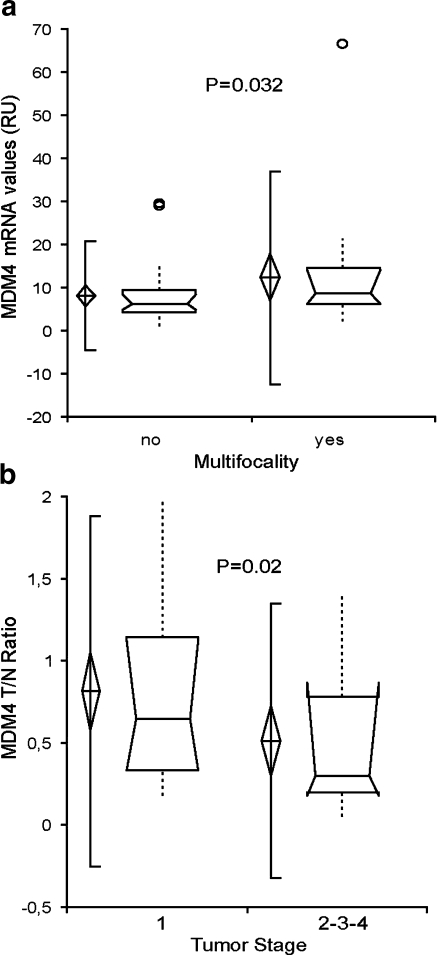
A wild-type (wt) p53 gene characterizes thyroid tumors, except for the rare anaplastic histotype. Because p53 inactivation is a prerequisite for tumor development, alterations of p53 regulators represent an alternative way to impair p53 function. Indeed, murine double minute 2 (MDM2), the main p53 negative regulator, is overexpressed in many tumor histotypes including those of the thyroid. A new p53 regulator, MDM4 (a.k.a. MDMX or HDMX) an analog of MDM2, represents a new oncogene although its impact on tumor properties remains largely unexplored. We estimated levels of MDM2, MDM4, and its variants, MDM4-S (originally HDMX-S) and MDM4-211 (originally HDMX211), in a group of 57 papillary thyroid carcinomas (PTC), characterized by wt tumor protein 53, in comparison to matched contra-lateral lobe normal tissue. Further, we evaluated the association between expression levels of these genes and the histopathological features of tumors. Quantitative real-time polymerase chain reaction revealed a highly significant downregulation of MDM4 mRNA in tumor tissue compared to control tissue (P<0.0001), a finding confirmed by western blot on a subset of 20 tissue pairs. Moreover, the tumor-to-normal ratio of MDM4 levels for each individual was significantly lower in late tumor stages, suggesting a specific downregulation of MDM4 expression with tumor progression. In comparison, MDM2 messenger RNA (mRNA) and protein levels were frequently upregulated with no correlation with MDM4 levels. Lastly, we frequently detected overexpression of MDM4-S mRNA and presence of the aberrant form, MDM4-211 in this tumor group. These findings indicate that MDM4 alterations are a frequent event in PTC. It is worthy to note that the significant downregulation of full-length MDM4 in PTC reveals a novel status of this factor in human cancer that counsels careful evaluation of its role in human tumorigenesis and of its potential as therapeutic target.
Figures
References
-
- {'text': '', 'ref_index': 1, 'ids': [{'type': 'DOI', 'value': '10.1038/sj.cdd.4401912', 'is_inner': False, 'url': 'https://doi.org/10.1038/sj.cdd.4401912'}, {'type': 'PubMed', 'value': '16543935', 'is_inner': True, 'url': 'https://pubmed.ncbi.nlm.nih.gov/16543935/'}]}
- Marine J-C, Francoz S, Maetens M, Wahl G, Toledo F, Lozano G (2006) Keeping p53 in check: essential and synergistic functions of Mdm2 and Mdm4. Cell Death Differ 13:927–934 - PubMed
-
- {'text': '', 'ref_index': 1, 'ids': [{'type': 'DOI', 'value': '10.1093/nar/26.15.3453', 'is_inner': False, 'url': 'https://doi.org/10.1093/nar/26.15.3453'}, {'type': 'PMC', 'value': 'PMC147746', 'is_inner': False, 'url': 'https://pmc.ncbi.nlm.nih.gov/articles/PMC147746/'}, {'type': 'PubMed', 'value': '9671804', 'is_inner': True, 'url': 'https://pubmed.ncbi.nlm.nih.gov/9671804/'}]}
- Momand J, Jung D, Wilczynski S, Niland J (1998) The MDM2 gene amplification database. Nucleic Acids Res 26:3453–3459 - PMC - PubMed
-
- {'text': '', 'ref_index': 1, 'ids': [{'type': 'DOI', 'value': '10.1242/jcs.03362', 'is_inner': False, 'url': 'https://doi.org/10.1242/jcs.03362'}, {'type': 'PubMed', 'value': '17251377', 'is_inner': True, 'url': 'https://pubmed.ncbi.nlm.nih.gov/17251377/'}]}
- Marine J-C, Dyer MA, Jochemsen AG (2007) MDMX; from bench to bedside. J Cell Sci 120:371–8 - PubMed
-
- {'text': '', 'ref_index': 1, 'ids': [{'type': 'DOI', 'value': '10.1016/j.molcel.2007.03.006', 'is_inner': False, 'url': 'https://doi.org/10.1016/j.molcel.2007.03.006'}, {'type': 'PubMed', 'value': '17386256', 'is_inner': True, 'url': 'https://pubmed.ncbi.nlm.nih.gov/17386256/'}]}
- Shmueli A, Oren M (2007) Mdm2: p53’s lifesaver? Mol Cell 25:794–796 - PubMed
-
- {'text': '', 'ref_index': 1, 'ids': [{'type': 'DOI', 'value': '10.1016/j.molcel.2007.02.008', 'is_inner': False, 'url': 'https://doi.org/10.1016/j.molcel.2007.02.008'}, {'type': 'PubMed', 'value': '17349959', 'is_inner': True, 'url': 'https://pubmed.ncbi.nlm.nih.gov/17349959/'}]}
- Rinaldo C, Prodosmo A, Mancini F, Iacovelli S, Sacchi A, Moretti F, Soddu S (2007) MDM2-regulated degradation of HIPK2 prevents p53Ser46 phosphorylation and DNA damage-induced apoptosis. Molecular Cell 25:739–750 - PubMed
Publication types
MeSH terms
Substances
LinkOut - more resources
Full Text Sources
Medical
Research Materials
Miscellaneous
