

Review
doi: 10.1021/cr050262p.
Carbonic anhydrase as a model for biophysical and physical-organic studies of proteins and protein-ligand binding
Affiliations
- PMID: 18335973
- PMCID: PMC2740730
- DOI: 10.1021/cr050262p
Item in Clipboard
Review
Carbonic anhydrase as a model for biophysical and physical-organic studies of proteins and protein-ligand binding
Chem Rev.
2008 Mar.
No abstract available
Figures
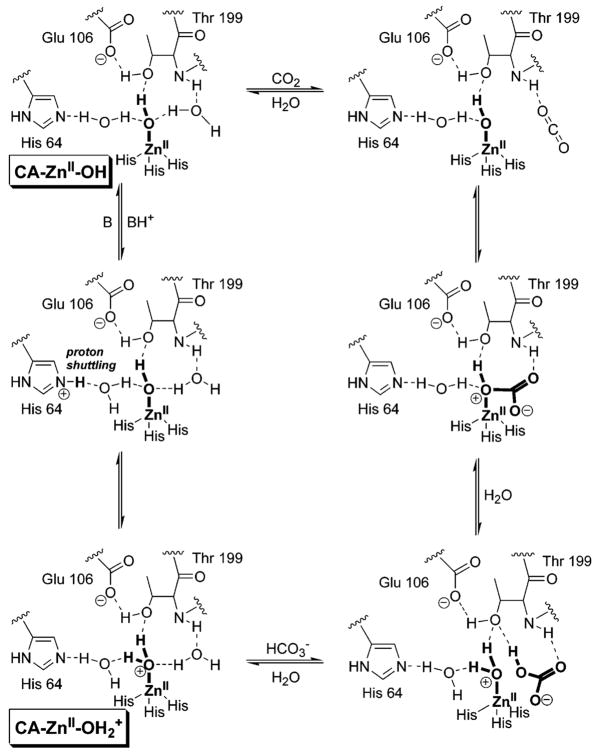
Mechanism of catalysis of the hydration of CO2 by HCA II. The putative structures of the species CA–OH and CA–OH2+, discussed in detail in the text, are indicated. We show the formal charge only on the zinc-bound water (and not the histidine residues) to emphasize that this water ligand is acidic (analogous to a hydronium ion being acidic) and adopt this convention throughout the remainder of the review.
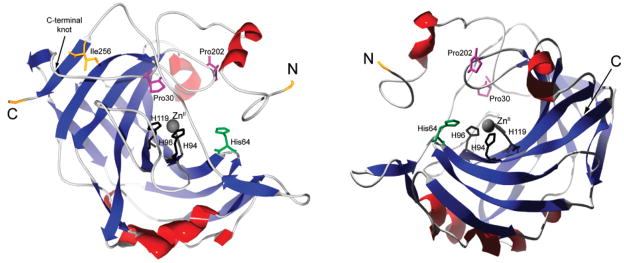
Ribbon rendering of HCA II from two perspectives, with α-helices in red and β-sheets in blue. The N- and C-termini, the C-terminal knot, and the primary residues involved in the initiation of folding and of coordinating the ZnII cofactor are indicated.
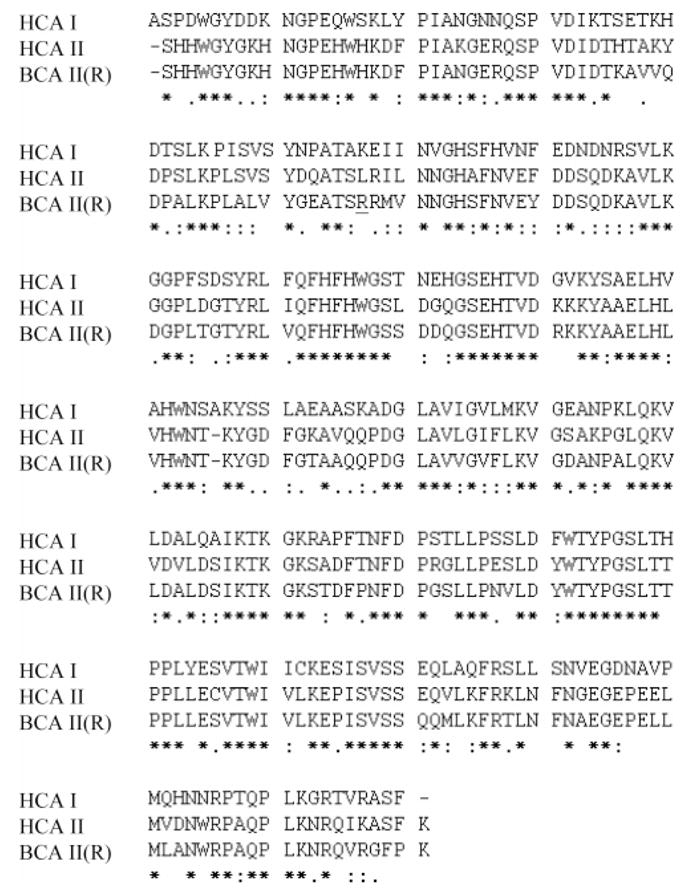
Amino acid sequences of HCA I, HCA II, and BCA II. Sequence homology is denoted by the symbols “*”, “:”, and “.”; “*” represents identical residues, “:” represents charge/polarity conserved residues, and “.” denotes polarity conserved residues. BCA II exists as two variants: an “R” form (shown here), where residue 56 exists as an Arg, and a “Q” form, where it exists as Gln. This residue is underlined above.
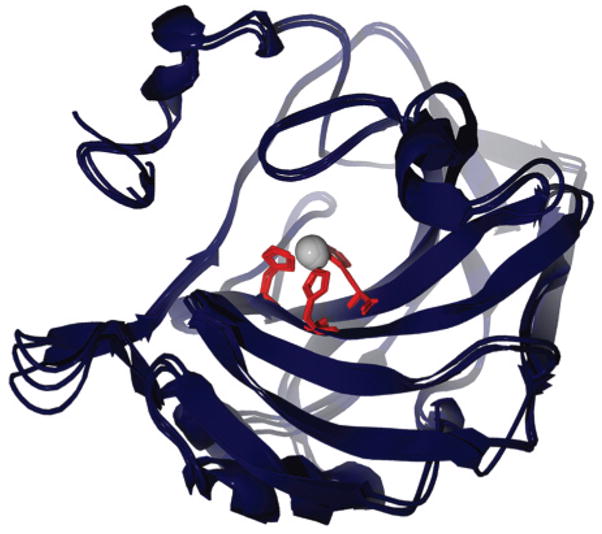
Overlay of X-ray structures of HCA I, HCA II, and BCA II, with His residues in the active site highlighted. This image was rendered using POV-Ray 3.5 (www.povray.org ). The accession numbers from the protein data bank (PDB) for the rendered structures are 2CAB (HCA I), 2CBA (HCA II), and 1V9E (BCA II).,,
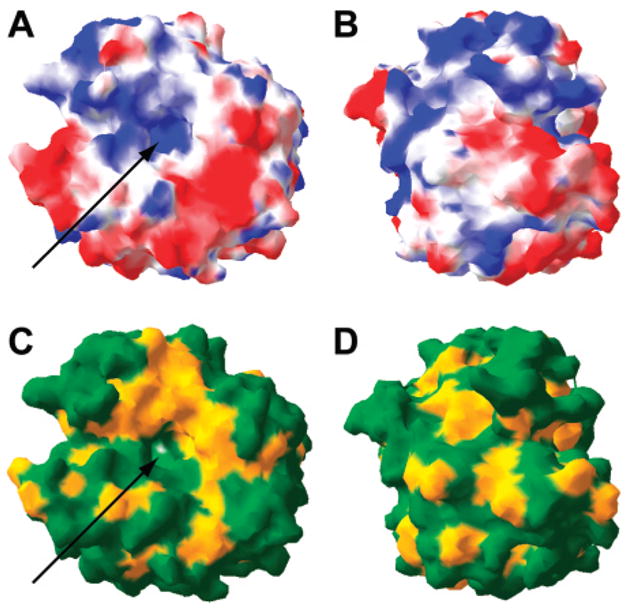
Surface rendering of opposite faces of HCA II (PDB/2CBA184) showing (A and B) acidic residues in red and basic residues in blue and (C and D) hydrophobic residues in yellow and polar residues in green. At pH 7–8, the red regions have a negative charge; the blue regions have a positive charge. The arrows indicate the active site.
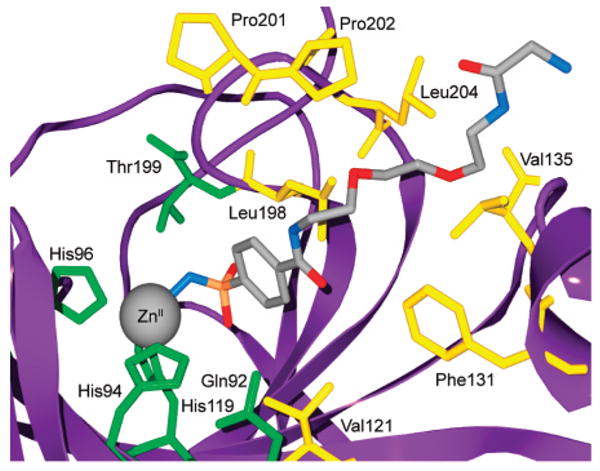
Model for the binding of compound 84 to HCA II based on the deposited X-ray crystallographic coordinates (PDB/1CNW). Catalytically important residues and residues that contribute to the primary and secondary hydrophobic binding sites for this ligand are shown.
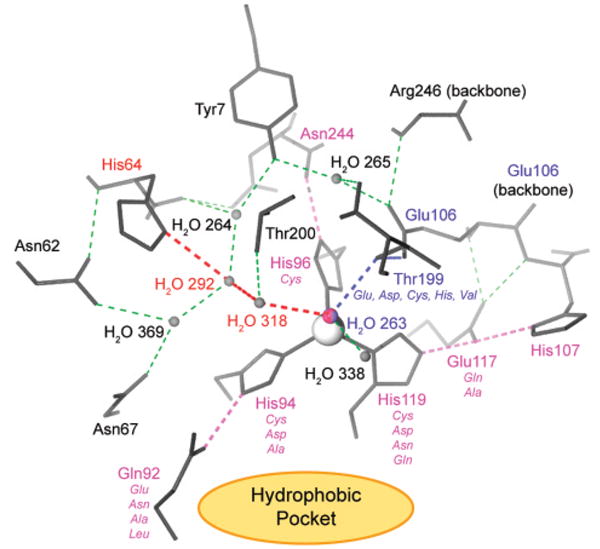
Hydrogen bonding in the active site of HCA II. All hydrogen bonds are shown in dashed lines. In pink are the hydrogen bonds and residues involved in orienting the imidazole rings of His94, His96, and His119. In blue are the residues involved in orienting the lone pairs on the zinc-bound hydroxyl ion for optimal nucleophilic attack. In red are the water molecules and His64 that make up the proton shuttle that regenerates the zinc-bound hydroxyl ion via deprotonation of the zinc-bound water molecule. The thin green dashed lines represent other, less crucial hydrogen bonds within the active site and further buried residues adjacent to the active site. The view is down an axis made up of the catalytic ZnII cofactor (gray) and the zinc-bound hydroxyl ion (H2O 263). The hydrophobic pocket (see Figure 6) lies in the area indicated by the orange ellipse and extends to the space above His119, His96, and Thr200. In italics are mutations of direct (Thr199, His119, His96, His94) and indirect (Glu117, Gln92) ligands to ZnII, carried out by Fierke and Christianson (section 6). Modified with permission from ref . Copyright 2004 American Chemical Society.
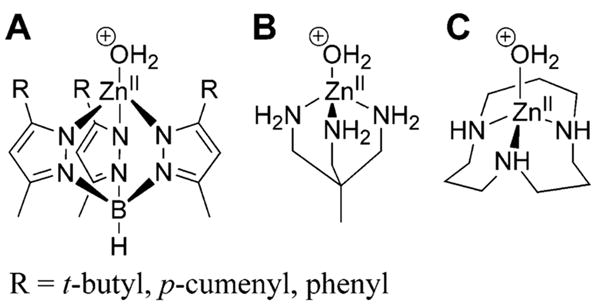
Examples of ZnII-containing metallo-organic models of the active site of CA: (A) tris(pyrazolyl)borate family of ligand, (B) 1,1,1-tris(aminomethyl)ethane, and (C) 1,5,9-triazacyclododecane.
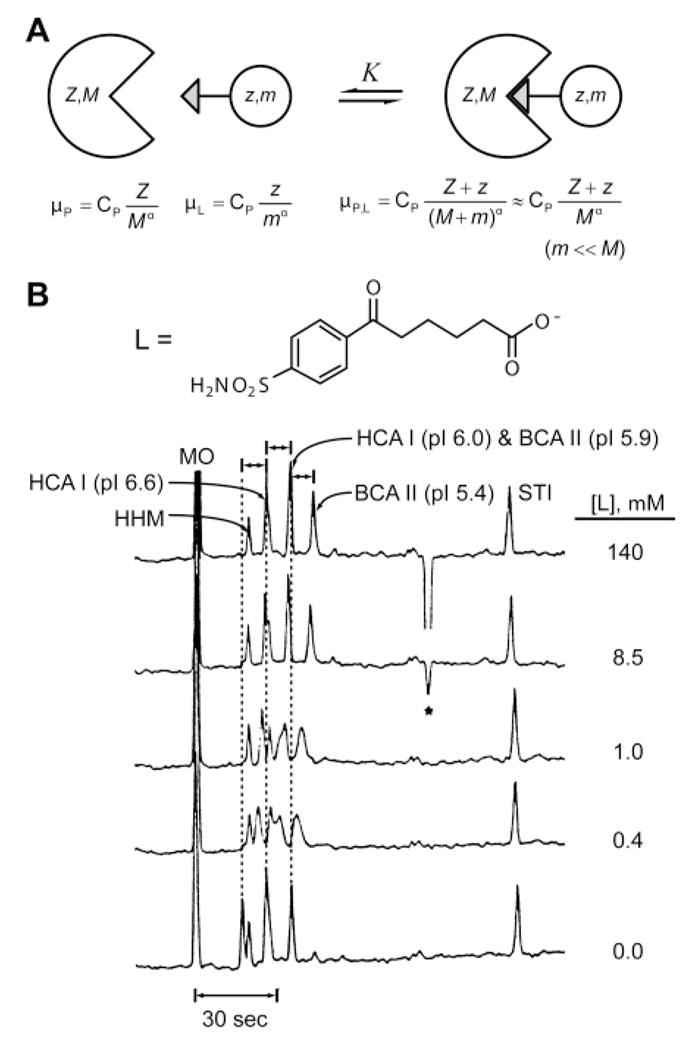
(A) Diagram sketching the species involved in an experiment comprising a receptor of molecular weight M and charge ±Z and a ligand of molecular weight m (m ≪ M) and charge z (both Z and z can be either positive or negative). (B) Electropherograms (by ACE) conducted on the mixture of isozymes of carbonic anhydrase: HCA I (pI = 6.6), HCA I (pI = 6.0), BCA II (pI = 5.9), and BCA II (pI = 5.4). An electrically neutral marker (mesityl oxide, MO) and two noninteracting proteins (soybean trypsin inhibitor (STI) and horse heart myoglobin (HHM)) were added to the mixture. Shifts in mobility were observed for the isozymes of carbonic anhydrase with increasing concentration of negatively charged ligand L (shown), while the mobility of noninteracting proteins remained constant. The dissociation constant Kd between BCA II and the ligand was determined to be 1.7 μM. Adapted with permission from ref . Copyright 1998 Wiley-VCH.
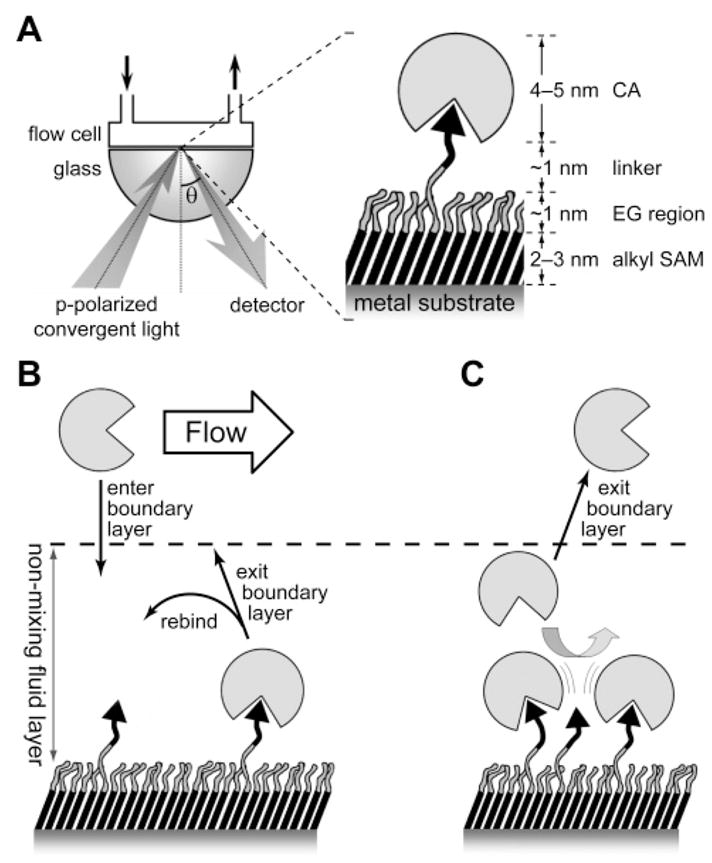
Measuring the binding of CA to self-assembled monolayers using surface plasmon resonance: (A) schematic of the apparatus and the overall molecular structure at the solid–liquid interface, (B) effects of mass transport on measurements of binding, and (C) effects of lateral sterics on binding of CA at densely populated surfaces.
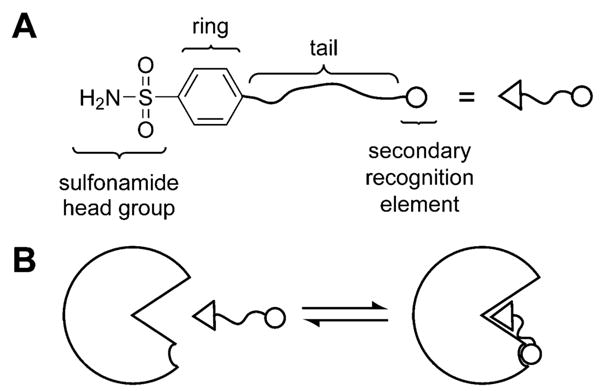
Binding of arylsulfonamide to carbonic anhydrase (CA). (A) Structure of a general arylsulfonamide ligand showing the structural features that can be modified (to a first approximation) independently. (B) The interactions between the different structural components of a general arylsulfonamide ligand and CA.
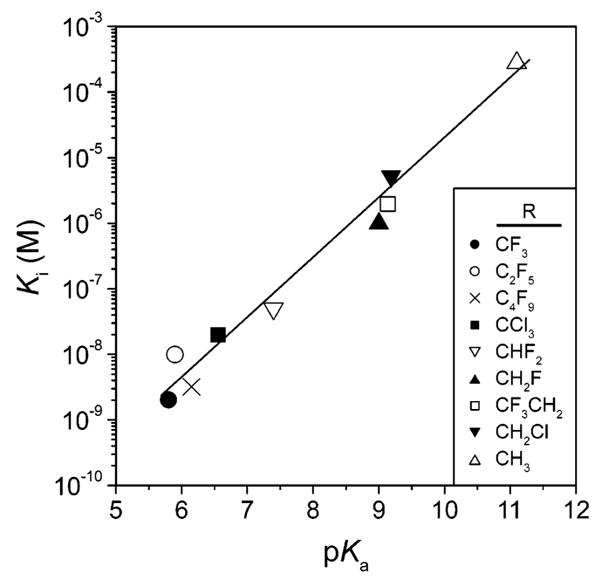
Linear dependence between Ki (on a logarithmic scale) and p Ka for a series of halogen-substituted unbranched aliphatic sulfonamides (R–SO2NH2). Data taken from ref .
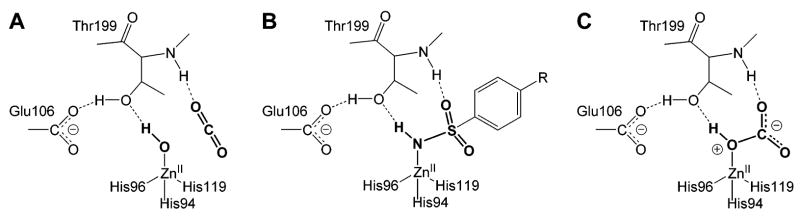
Diagram comparing (A) carbon dioxide (putative interactions), (B) an arylsulfonamide, and (C) bicarbonate bound in the active site of HCA II. The arylsulfonamide can be viewed as a transition-state analogue of the hydratase reaction (H2O + CO2 ⇆ HCO3− + H+.
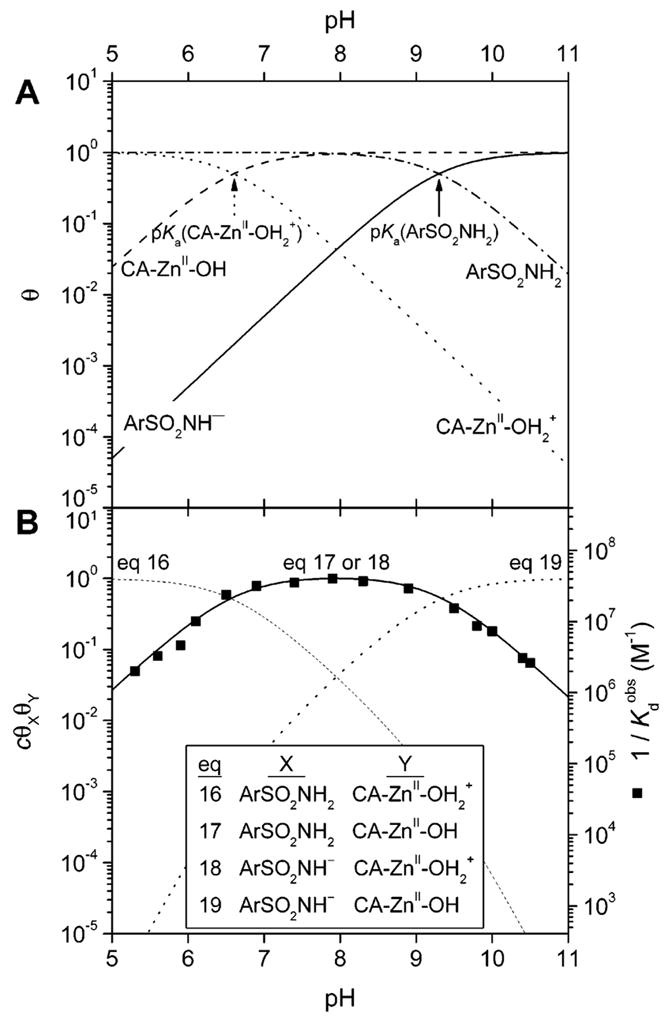
Fractions of arylsulfonamide and carbonic anhydrase II in their protonated and deprotonated forms, and the affinity of arylsulfonamides for HCA II, as a function of pH. (A) pH-dependence of the fractions (θ) of arylsulfonamide (ArSO2NH2 and ArSO2NH−, eq 20a) and carbonic anhydrase II (CA–ZnII–OH2+ and CA–ZnII–OH, eq 20b) in protonated and deprotonated forms. The values of pKa used were 6.6 for CA–ZnII–OH2+ and 9.3 for ArSO2NH2. (B) Simulations (shown as lines) and experimental data (shown as black squares for p-nitrobenzenesulfonamide, 3; data taken from ref 302) of the affinity of arylsulfonamides for HCA II. The simulated curves are the products of the fractions of HCA II and arylsulfonamide in the reactive forms given in eqs 16–19 (see text). The curves have been scaled to give a maximum value of unity (using constant c) to facilitate comparisons between curves. Simulated curves using eqs 17 and 18 are identical, and thus, the two equations are thermodynamically indistinguishable.
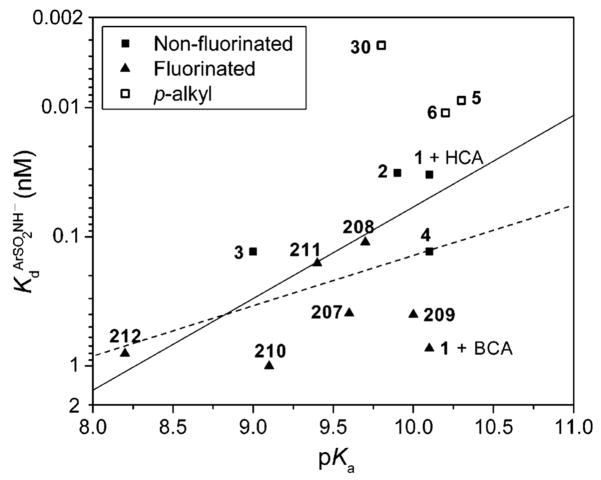
Brønsted plot for the variation of KdArSO2NH− (defined in eq 21) for the binding of substituted benzenesulfonamide anions to carbonic anhydrase II (CA II) with pKa of the sulfonamide (see Table 11). The y-axis is plotted such that tighter-binding ligands are at the top of the graph. We included substituted benzenesulfonamides that we presume do not have hydrophobic contacts with CA II other than a conserved interaction of their phenyl rings. Compounds 6, 30, and 37 (shown as open squares) contain methyl groups attached to the phenyl ring and so could have additional hydrophobic contacts with CA II. The solid line shows a fit to all of the experimental points and gives a value for β of 0.7 with R2 of 0.26. The dashed line shows a fit to the data omitting the open squares; it gives a value for β of 0.4 with R2 of 0.20. The poor fits for both lines suggest that the binding of these compounds to CA II involves substantially different balances of contributions from different types of interactions (e.g., ZnII–N bond, hydrogen-bond network, and hydrophobic effects).
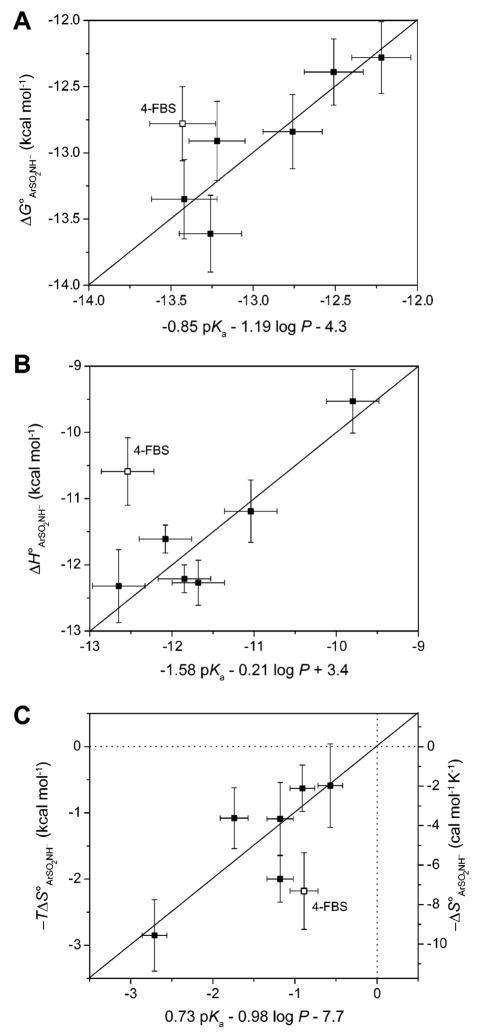
Quantitative structure–activity relationships (QSARs) between ΔG∘ ArSO2NH− (A), ΔH∘ ArSO2NH− (B), and −TΔS∘ ArSO2NH− (C) and pKa and log P for the binding of fluorine-substituted benzenesulfonamides (207–212) to BCA II. Data are shown for QSARs in which those for 4-fluorobenzenesulfonamide (209, 4-FBS) were omitted; Krishnamurthy et al. have suggested that this ligand interacts in a different way with the enzyme than do the other ligands. The y-error bars are uncertainties described in Table 14, and the x-error bars were obtained by propagating uncertainties in pKa and log P. The horizontal and vertical dotted lines in (C) separate favorable (−TΔS∘ < 0) from unfavorable (−TΔS∘ > 0) entropy of binding. Modified with permission from ref . Copyright 2007 Wiley-VCH.
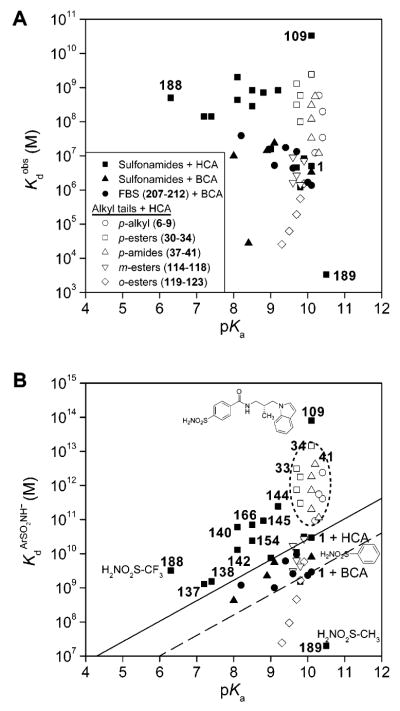
Variation of (A)
and (B) KdArSO2NH− (defined in eq 21) with pKa(ArSO2NH2) for the binding of arylsulfonamides (shown in Table 11) to human (HCA) and bovine carbonic anhydrase II (BCA). The filled circles and filled triangles are data for the binding of ligands to BCA; the other symbols are data for the binding of ligands to HCA. The pKa of compound 109 has not been reported in the literature; we take it to be 10 based on its structure. The open symbols represent the binding of three series of benzenesulfonamides with alkyl chains to HCA. These compounds demonstrate that the affinity of substituted benzenesulfonamides with alkyl chains for CA increases with the length (and, thus, hydrophobicity) of the chain. We placed the dashed and solid lines (with slopes of 0.6; see text) to pass through the value of Kd ArSO2NH− for unsubstituted benzenesulfonamide (1) complexed with HCA (solid line) and with BCA (dashed line). The dotted ellipse segregates compounds that bind more tightly than benzenesulfonamide by virtue of hydrophobic contacts with the surface of the conical cleft just outside of the active site. We discuss 109 separately in the text.
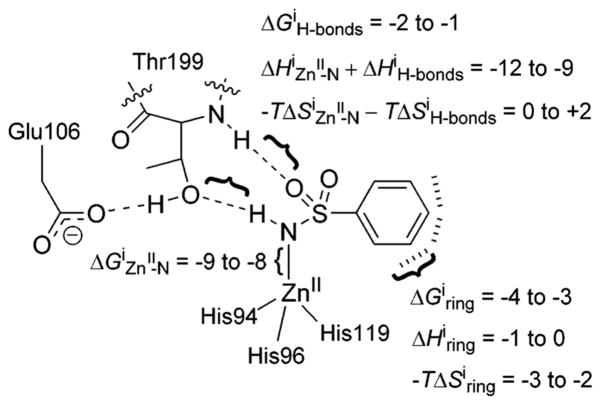
Estimated free energies, enthalpies, and entropies (all in kcal mol −1) for the different structural interactions between fluorinated benzenesulfonamide anions and CA–ZnII–OH2+. Reproduced with permission from ref . Copyright 2007 Wiley-VCH.
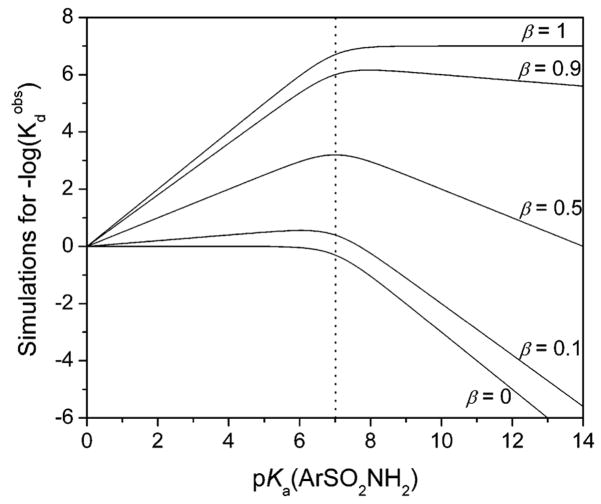
Variation of pKa of the arylsulfonamide that will theoretically give the highest affinity ligand (lowest value of
) to carbonic anhydrase II with β (eq 23). The curves were generated with a pH of the buffer of 7 (indicated by dotted vertical line).
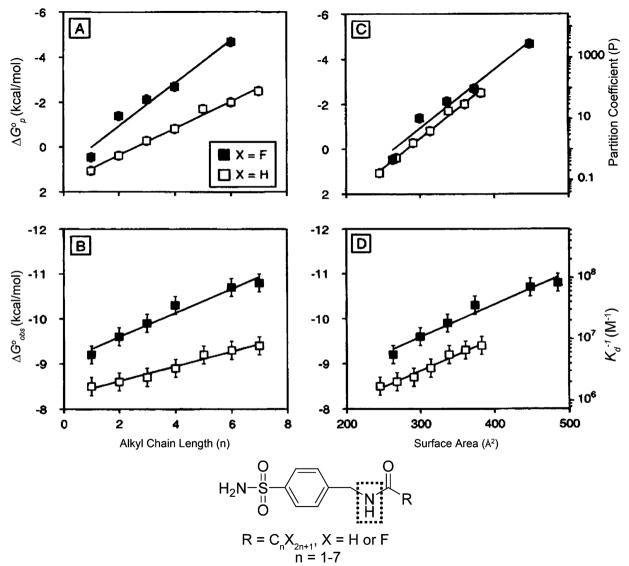
Variation of the observed free energy of binding to BCA II (ΔG∘obs) and the free energy of partitioning between octanol and water (ΔG∘p) of benzenesulfonamides containing alkyl and fluoroalkyl tails with the length of the tail (A and B) and with the molecular surface areas of the ligands (C and D). The plots show linear fits to the data. The differences in slopes between the alkyl and fluoroalkyl series in plots of ΔG∘obs (A) or ΔG∘p (B) vs length of the tail were eliminated when these values were plotted vs molecular surface areas of the ligands (C and D). Gao et al. believe that the –NH– of the carboxamide (enclosed in the dotted box) forms hydrogen bonds with residues of the active site of BCA II. Modified with permission from ref . Copyright 1995 American Chemical Society.
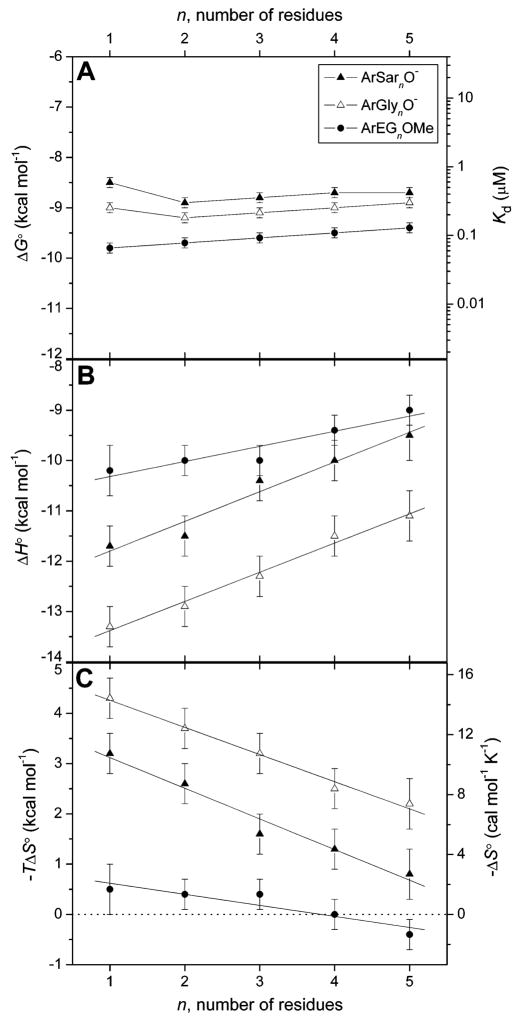
Variation in (A) observed free energy of binding and dissociation constant, (B) enthalpy of binding, and (C) entropy of binding with the number of residues in the chain for para-substituted benzenesulfonamides with oligoethylene glycol (ArEGnOMe, 72–76), oligoglycine (ArGlynO–, 63–67), and oligosarcosine (ArSarnO−,213–217) chains to BCA II. Linear fits to the data in (B) and (C) are shown. The observed fitting parameters (slope in kcal mol−1 residue−1, y-intercept in kcal mol−1) are as follows: (for (B), in ΔH∘) ArGlynO− (0.58 ± 0.04, −14.0 ± 0.1), ArSarnO− (0.59 ±0.07, −12.4 ± 0.2), ArEGnOMe (0.30 ± 0.06, −10.6 ± 0.2); (for (C), in −TΔS∘) ArGlynO− (−0.54 ± 0.03, 4.8 ± 0.1), ArSarnO− (−0.61 ± 0.06, 3.7 ± 0.2), ArEGnOMe (−0.22 ± 0.05, 0.8 ± 0.2). Uncertainties were given by the linear least-squares fitting procedure. The horizontal dashed line in (C) separates favorable (−TΔS∘< 0) from unfavorable (−TΔS∘ > 0) entropy of binding. Reproduced with permission from ref . Copyright 2006 American Chemical Society.
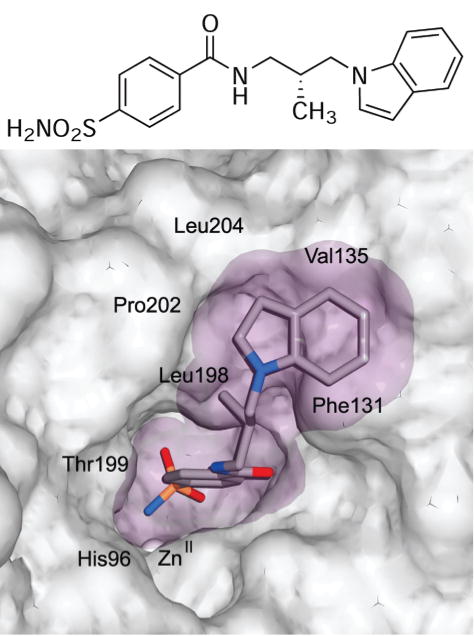
Structure of the active site of HCA II bound to compound 109 (shown as a chemical structure). The van der Waals surface of the enzyme is opaque gray, and that of the ligand is translucent purple. Relevant residues are indicated, most notably Leu198 and Pro202 on the hydrophobic wall.
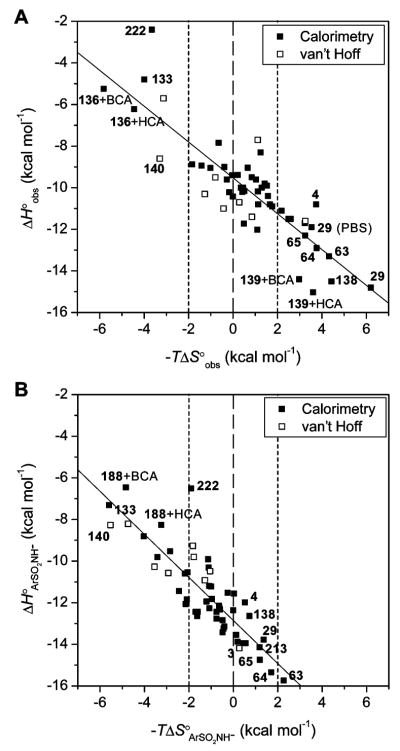
Variation of enthalpy with entropy for the association of arylsulfonamides with CA II. Plots for the (A) observed thermodynamic parameters and (B) those calculated for the association of the arylsulfonamide anion with CA –ZnII–OH2+ (eq 18; Scheme 1) using eq 25 are shown. The data are listed in Tables 13 and 14. The fitting parameters and correlation coefficients (slope, y-intercept in kcal mol−1, and R2) are as follows: for (A) −0.86 ± 0.07, −9.52 ± 0.17, and 0.74, and for (B) −1.03 ± 0.09, −12.85 ± 0.18, and 0.74. Uncertainties are from the least-squares fitting procedure. The dashed lines separate favorable (−TΔS∘ < 0) from unfavorable (−TΔS∘ > 0) entropy of binding, and the dotted lines are placed to signify “moderate” entropy of binding with a magnitude of TΔS∘ ≤ 2 kcal mol−1.
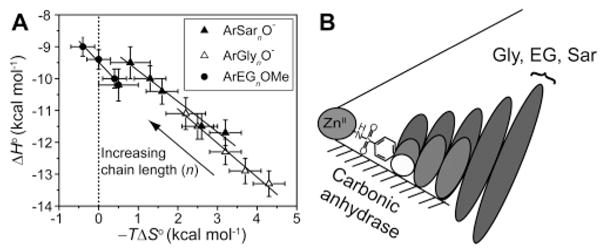
Association of para-substituted benzenesulfonamides with oligoethylene glycol (ArEGnOMe, 72–76), oligoglycine (ArGlynO–, 63–67), and oligosarcosine (ArSarnO−, 213–217) tails with bovine carbonic anhydrase II. (A) Enthalpy/entropy compensation plot for the association. The solid lines are linear fits to the data sets and give values for the compensation (from the slopes) as follows: −0.96 ± 0.08 (ArSarnO−), −1.07 ± 0.07 (ArGlynO−), and −1.32 ± 0.09 (ArEGnOMe); these observations demonstrate near-perfect compensation between enthalpy and entropy. The dotted vertical line separates favorable (−TΔS∘ < 0) from unfavorable (−TΔS∘ > 0) entropy of binding. (B) A schematic diagram for the association. This schematic diagram represents the catalytic cleft of the enzyme as a cone with the ZnII cofactor at the apex. The bottom surface (shaded) of the cleft is the “hydrophobic wall” of the enzyme. Ellipses depict the residues of the ligand; the sizes of the ellipses are qualitatively proportional to the mobility of the individual residues. Benzenesulfonamide ligands with one (white), three (light gray), and five (dark gray) residues in the tail are shown. Modified with permission from ref . Copyright 2006 American Chemical Society.
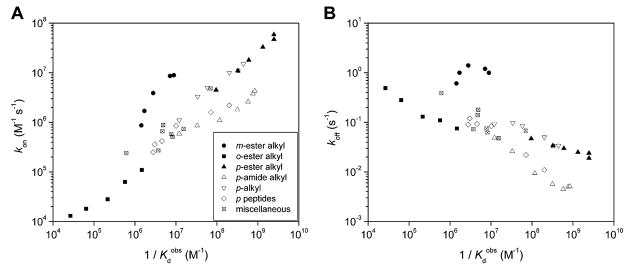
Variation of kon (A) and koff (B) with the (equilibrium) dissociation constant,
, for several classes of arylsulfonamides. Structures for the different series are listed in Table 10 as follows: m-ester alkyl (114–118), o-ester alkyl (119–123), p-ester alkyl (30–35), p-amide alkyl (37–43), p-alkyl (7–10), p-peptides (63, 66, 223–226), and miscellaneous sulfonamides (1–3, 29, 133, 135, 137, 166, 168), and data listed in Table 15.
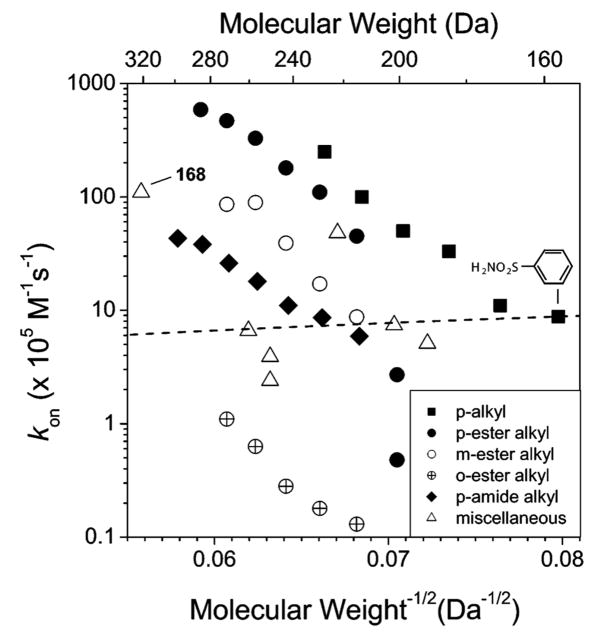
Variation of kon with the molecular weight of several classes of arylsulfonamides. Structures for the different series are listed in Table 10 as follows: p-alkyl (1 and 6–10), p-ester alkyl (29–35), m-ester alkyl (114–118), o-ester alkyl (119–123), p-amide alkyl (37–43), and miscellaneous sulfonamides (2, 3, 29, 133, 135, 137, and 168), and data listed in Table 15. The slope of the dashed line represents the dependence of kon on molecular weight that would be expected for a diffusion-controlled reaction, kon ≈ (molecular weight)−1/2. The line is drawn to pass through the value of kon for benzenesulfonamide (1).
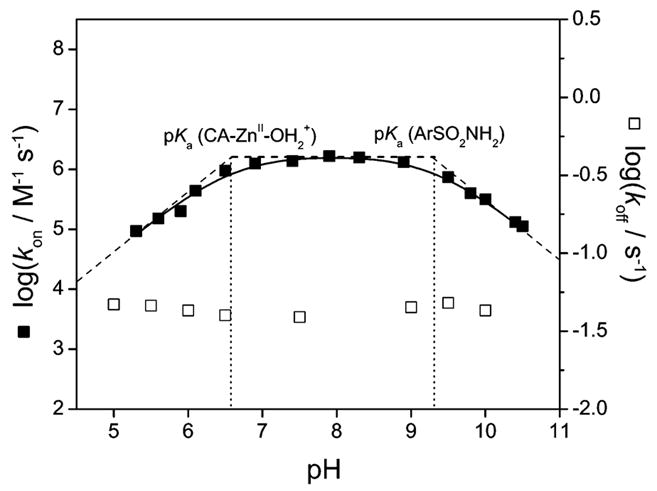
pH-dependence of the logarithms of rate constants for association (kon) and for dissociation (koff) of p-nitrobenzenesulfonamide (3) with human carbonic anhydrase II (HCA II). The open squares are experimental data for koff and are pH-independent over the range examined. The black squares are experimental data for kon, and the solid line is a simulation using eq 28 or 29 (see text) with a pKa of 6.6 for CA–ZnII–OH2+ and a pKa of 9.3 for the arylsulfonamide. The dashed lines are tangents to the simulation at three regimes (slopes of 1, 0, and −1), and the dotted vertical lines show the values of pKa. Data taken from Taylor et al.
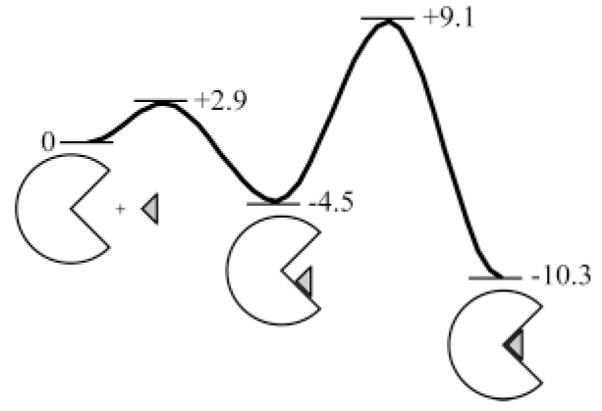
Possible free-energy diagram for the association of an arylsulfonamide with carbonic anhydrase. The values of energy shown for the different states are in kcal mol−1 and have been taken from experimental values for the association of p-nitrobenzene-sulfonamide (3) with HCA II. Data taken from King and Burgen.
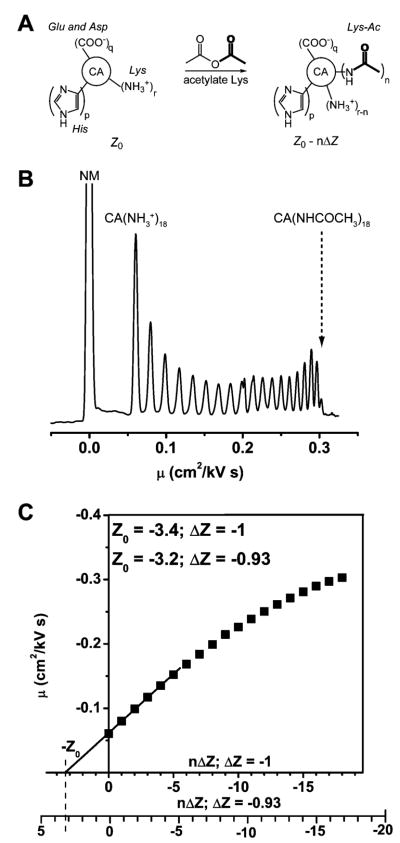
(A) Diagram summarizing the formation of a protein charge ladder. A protein contains multiple ionizable residues (only Lys, Asp or Glu, and His shown here), the charge state of which depends on the value of pH of the solution and the pKa of the residue. Acetic anhydride reacts with the α-NH3+ groups of lysine residue. The resulting mixture contains protein derivatives with different numbers and positions of acetylated lysine residues. (B) CE electropherogram showing the separation of the rungs of the charge ladder of BCA II, plotted on mobility (μ) scale. The peak labeled NM corresponds to the electrically neutral molecule (p-methoxybenzylalcohol) used to monitor electroosmotic flow. Native BCA II (CA(NH3+)18) and the last rung of the ladder (CA-(NHCOCH3)18) are also labeled on the plot. The separation was done in tris-Gly, pH 8.4 buffer in a capillary measuring 47 cm in total length and 40 cm to the detector. (C) Plot of mobility (μ) of each rung versus the number of modified residues. Two x-axes are shown with calibration of ΔZ = −1 and ΔZ = −0.93. Linear regression line through the first six points provides the charge on the native protein at the intersection with the abscissa. The charge Zo of the native BCA II is estimated to be −3.4 if ΔZ = −1 and −3.2 if ΔZ = −0.93. Modified with permission from ref . Copyright 2003 American Chemical Society.
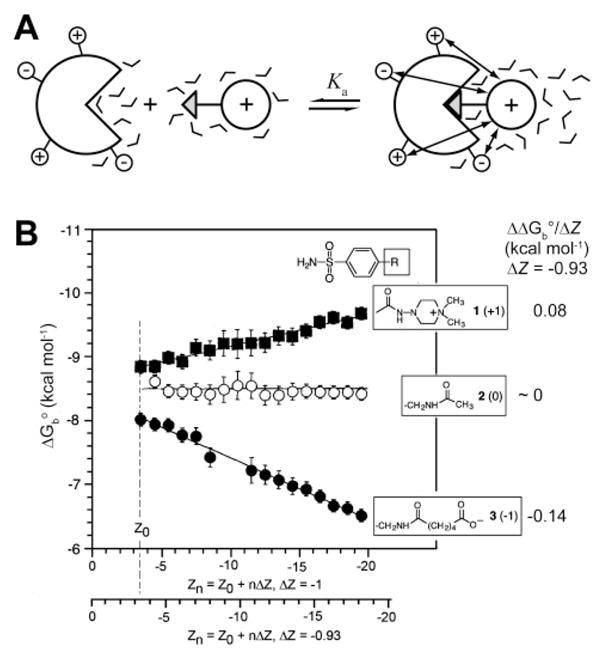
(A) Diagram illustrating the long-ranged electrostatic interactions of charged ligand with charges on the surface of the protein upon binding. (B) Dependence of the free energy of binding of negative, neutral, and positive ligands on the charge of a rung of a charge ladder of BCA II. Electrostatic contribution to the free energy of ligand binding is found to be 0 for a neutral ligand, 0.08 kcal mol−1 per unit charge for a positively charged ligand, and −0.14 kcal mol−1 for a negatively charged ligand with ΔZ = −0.93. Modified with permission from ref . Copyright 1996 American Association for the Advancement of Science; www.sciencemag.org .
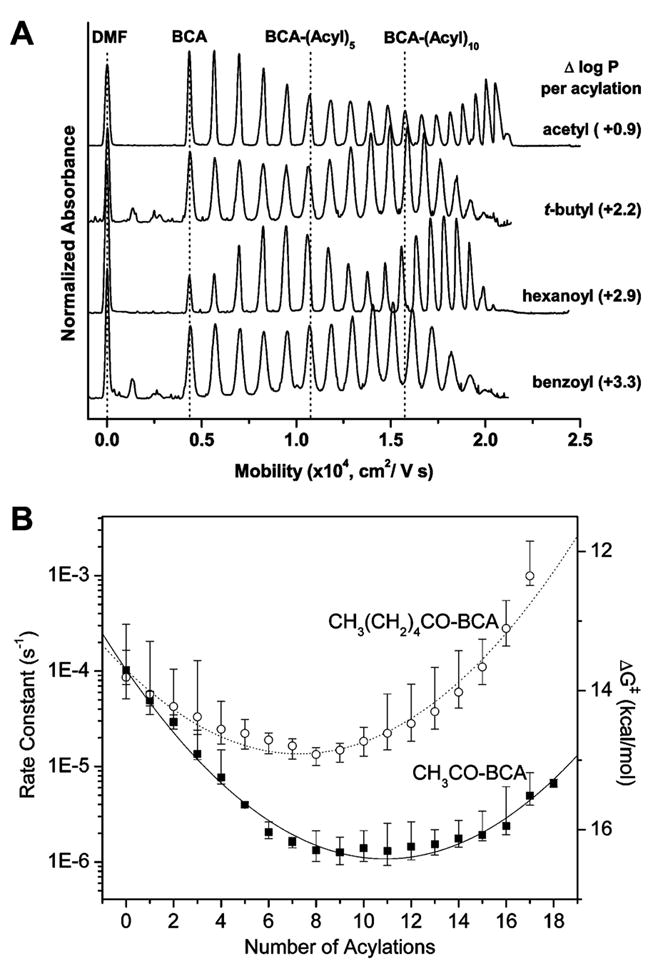
(A) Electropherograms of hydrophobic charge ladders of BCA II. The figure shows the increase in hydrophobicity parameter (log P) for reactions from –NH3+ to respective –NH–Acyl group. The dashed vertical lines mark the number of modifications and indicate that the mobilities of the early rungs of all ladders are indistinguishable, but the mobilities of the late rungs vary between the ladders, possibly due to the effects of increasing drag. Dimethylformamide (DMF) is used as an electrically neutral molecule to monitor the electroosmotic flow. (B) Rate constants and activation energies, calculated from transition-state theory, for denaturation of acetyl (CH3CO–BCA, (■)) and hexanoyl (CH3(CH2)4CO–BCA, (○)) ladders of BCA II. The lines show the fit of the model, qualitatively described in the text. Adapted with permission from ref . Copyright 2006 The Biophysical Society.
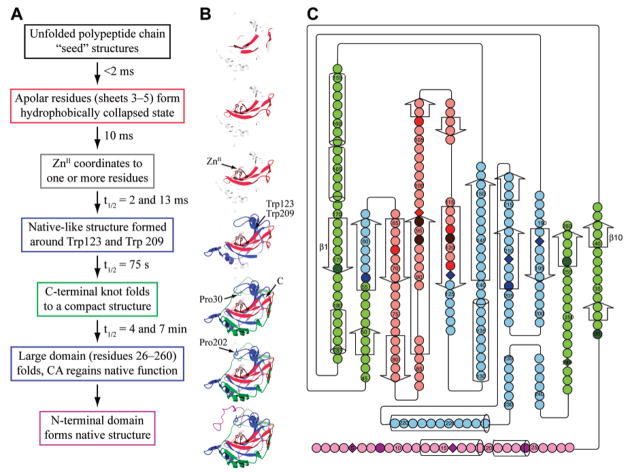
(A) Schematic of the pathway for the refolding of HCA II that has been denatured with GuHCl. (B) Three-dimensional representations of each intermediate in the refolding pathway outlined in (A). Unfolded sections of the enzyme are depicted as transparent ribbon structures superimposed on the already folded (colored) ribbon structures. The colors for each folded intermediate correspond to the colors used in part (C). (C) A two-dimensional representation of HCA I. The ten β-strands comprising the central β-sheet structure are numbered from left to right. Trp residues are displayed as diamonds. Darkly colored residues have been probed directly (see text) either by solvent accessibility, fluorescence quenching, or NMR. Lightly colored residues have not been probed directly, but their properties are inferred from neighboring residues. Red-colored residues retain structure at 8 M GuHCl. The brown residues are the His residues that chelate the ZnII cofactor. The blue residues have structure in the molten-globule intermediate but are denatured at concentrations of GuHCl greater than 1.5 M. The green residues are required to have their native conformation before enzymatic activity is observed but are denatured in the molten-globule intermediate. The N-terminus is colored magenta; it folds after enzymatic activity is regained in the folding pathway. Adapted with permission from ref . Copyright 2003 American Chemical Society.
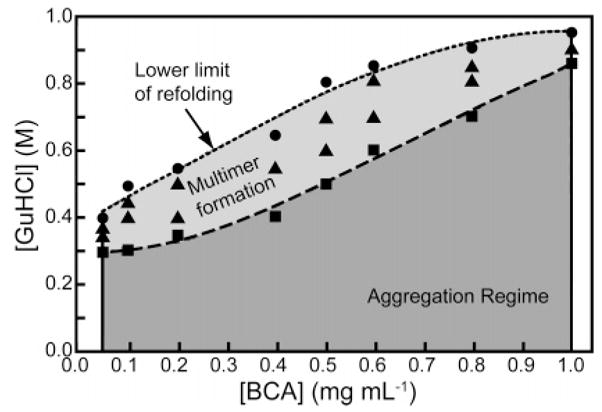
Regimes of refolding and aggregation of BCA II. Each datum represents rapid dilution of BCA II in 5 M GuHCl to a given final protein and GuHCl concentration. Conditions in the aggregation regime result in the immediate formation of micron-sized particulates. The upper boundary of the aggregation regime is defined by (■). Conditions in the multimer regime (▲) yielded measurable dimeric and trimeric species by CD before aggregation. The lower limit of refolding (●) is the regime where multimers form but do not proceed to form micron-sized particles. Adapted with permission from ref . Copyright 1990 American Chemical Society.
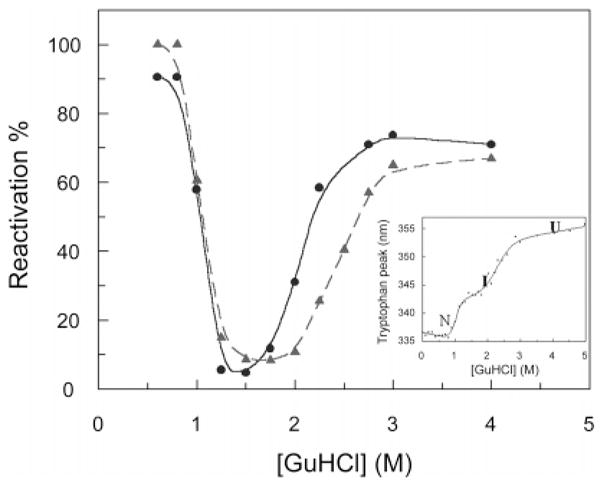
Yields of HCA II on refolding after denaturation with GuHCl. Reactivation of the enzyme was performed after incubation of protein for 24 h in the concentrations of GuHCl indicated on the x-axis. Refolding was induced by dilution of denatured enzyme to 0.3 M GuHCl in 0.1 M tris-H2SO4, pH 7.5, and a final protein concentration of 0.85 μM. The enzyme activity was recorded after 2 h of refolding. The concentration of HCA II in the denaturation solution was 11 μM (●) and 22 μM (▲). The reactivation yields form a troughlike shape, implying that the amount of protein that can be reactivated decreases in parallel with the increase in concentration of molten globule. Inset: The curve showing unfolding of HCA II as measured by tryptophan fluorescence. The excitation wavelength was 295 nm, and the emission was recorded in the interval 310–450 nm using 5 nm slits for both excitation and emission light. The native protein (N) is observed from 0 to 1 M GuHCl, the molten-globule intermediate (I) is observed from ~1.5 to 2.5 M GuHCl, and the unfolded protein (U) is observed above 3 M GuHCl. Reproduced with permission from ref . Copyright 1999 American Society for Biochemistry and Molecular Biology.
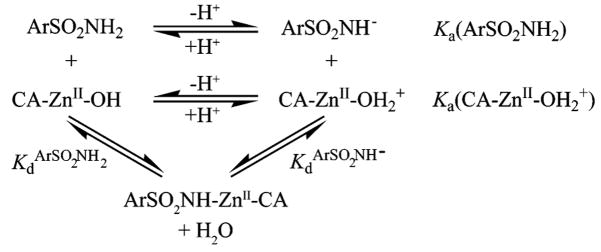
Equilibria for the Association of Arylsulfonamide (ArSO2NH2/ArSO2NH−) with Carbonic Anhydrase (CA–ZnII–OH2+/CA–ZnII–OH) (Reproduced with Permission from Ref ; Copyright 2007 Wiley-VCH)
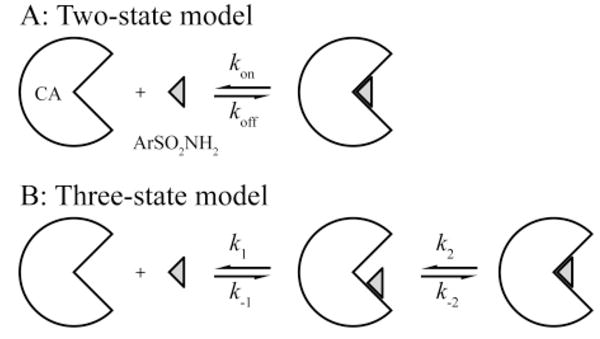
Two-State (A) and Three-State (B) Models for the Association of Arylsulfonamides with CA
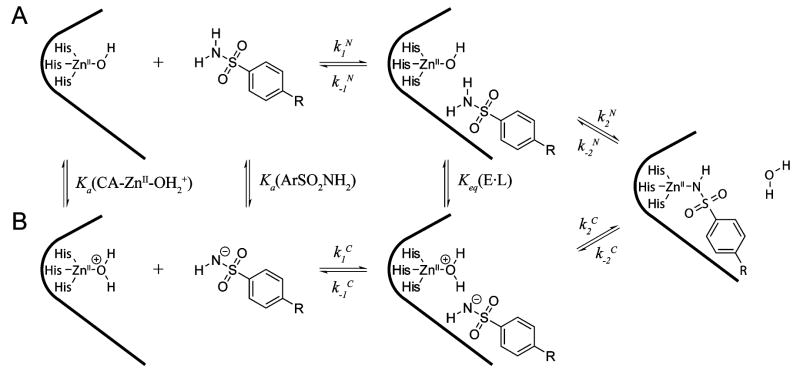
Three-State Models for the Association of Neutral (A) and Charged (B) Arylsulfonamides with CA
References
-
- Stams T, Christianson DW. In: The Carbonic Anhydrases: New Horizons. Chegwidden WR, Carter ND, Edwards YH, editors. Vol. 90 Birkhäuser Verlag: Basel, Switzerland; 2000.
-
- Supuran CT, Scozzafava A, Casini A. Med Res Rev. 2003;23:146. - PubMed
-
- Nishimori I, Minakuchi T, Kohsaki T, Onishi S, Takeuchi H, Vullo D, Scozzafava A, Supuran CT. Bioorg Med Chem Lett. 2007;17:3585. - PubMed
-
- Dill KA, Bromberg S. Molecular Driving Forces: Statistical Thermodynamics in Chemistry & Biology. Garland Science; New York: 2003.
Publication types
MeSH terms
Substances
Grants and funding
LinkOut - more resources
Full Text Sources
Other Literature Sources
