. 2008 Mar 11;6(3):e60.
doi: 10.1371/journal.pbio.0060060.

Phenotypic mismatches reveal escape from arms-race coevolution

Affiliations

Phenotypic mismatches reveal escape from arms-race coevolution

Charles T Hanifin et al. PLoS Biol. .

Abstract

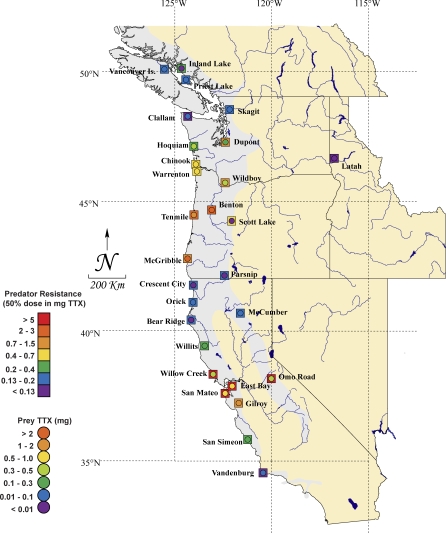
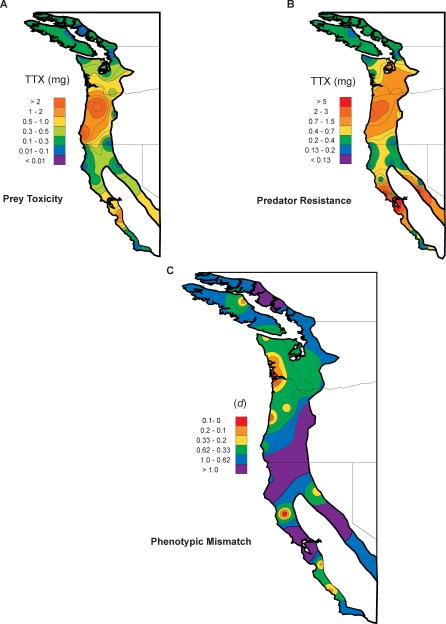
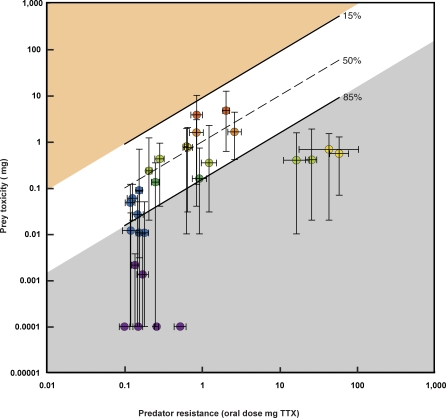
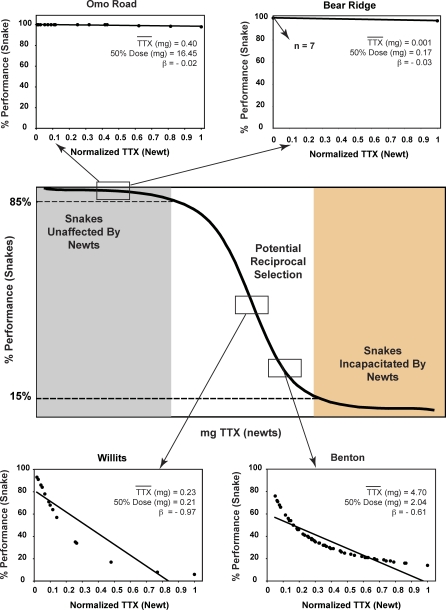
Because coevolution takes place across a broad scale of time and space, it is virtually impossible to understand its dynamics and trajectories by studying a single pair of interacting populations at one time. Comparing populations across a range of an interaction, especially for long-lived species, can provide insight into these features of coevolution by sampling across a diverse set of conditions and histories. We used measures of prey traits (tetrodotoxin toxicity in newts) and predator traits (tetrodotoxin resistance of snakes) to assess the degree of phenotypic mismatch across the range of their coevolutionary interaction. Geographic patterns of phenotypic exaggeration were similar in prey and predators, with most phenotypically elevated localities occurring along the central Oregon coast and central California. Contrary to expectations, however, these areas of elevated traits did not coincide with the most intense coevolutionary selection. Measures of functional trait mismatch revealed that over one-third of sampled localities were so mismatched that reciprocal selection could not occur given current trait distributions. Estimates of current locality-specific interaction selection gradients confirmed this interpretation. In every case of mismatch, predators were "ahead" of prey in the arms race; the converse escape of prey was never observed. The emergent pattern suggests a dynamic in which interacting species experience reciprocal selection that drives arms-race escalation of both prey and predator phenotypes at a subset of localities across the interaction. This coadaptation proceeds until the evolution of extreme phenotypes by predators, through genes of large effect, allows snakes to, at least temporarily, escape the arms race.


Conflict of interest statement

Competing interests. The authors have declared that no competing interests exist.

Figures

Figure 1
Figure 1. The Geographic Distribution of TTX Resistance of Garter Snakes and TTX Toxicity of Newts in Western North America
Twenty-eight populations of a snake predator, T. sirtalis (squares), and co-occurring toxic prey, Taricha newts (circles) sampled throughout western North America are shown. Colors (denoted in legend) indicate TTX-resistance as the amount of TTX (mg) required to reduce an average adult female Th. sirtalis (at a given locality) to 50% of its baseline performance and toxin level as the total amount of TTX (mg) expected in the skin of an average adult Taricha newt. The range of the genus Taricha is shown in gray, but extends beyond the area shown in the map to the north along the coast of British Columbia into southeastern Alaska.
Figure 2
Figure 2. The Interpolated Geographic Distribution of Phenotypes and Phenotypic matching for Newts and Snakes in Western North America
The interpolated geographic distribution of (A) prey toxicity, (B) predator resistance, and (C) the degree of phenotypic matching of these traits shown as isocline maps across the geographic range of sympatry in western North America. (A) Toxicity of prey shown as the total amount of tetrodotoxin (TTX) (mg) expected in the skin of an average adult animal based on the toxicity of 28 populations of Taricha newts in Figure 1. (B) Predator resistance shown as the amount of TTX (mg) required to reduce an average adult female T. sirtalis to 50% of its baseline performance based on the 28 populations in Figure 1. (C) The degree of phenotypic matching plotted as d, which measures the deviation from estimated match, at each locality, of the phenotypic interface of coevolution (i.e.. TTX toxicity in newts and TTX resistance of co-occurring snakes). Note that general overall patterns of relative phenotype exaggeration (yellow, orange, and red in (A) and (B)) are generally similar for newts and snakes throughout their range of sympatry. The matching analysis (Figure 3, Figure 4) and (C) shows that similarly elevated phenotypes do not necessarily match functionally.
Figure 3
Figure 3. Mismatch of Predator and Prey Phenotypes at 28 Localities of Newts and Snakes from Western North America
The functional relationship of average adult newt total skin toxicity (in mg TTX, log scale) is plotted against the oral dose of TTX (in mg, log scale) required to reduce the speed of an average adult female T. sirtalis to 50% of baseline speed post-ingestion against TTX (mg) for each locality. Individual points (circles) are colorized by average newt toxicity as in Figure 1. Vertical bars represent the full range of newt TTX values observed for each population; horizontal bars represent the 95% confidence interval for the oral dose 50% of the corresponding snake population. The 50% line (dashed) reflects the dose of TTX that would reduce a snake of given resistance to 50% of its performance (see Methods). The 15% and 85% lines (solid lines, calculated as best-fit regressions for each locality) delimit the range of functionally relevant TTX doses for snakes across the range of sampled localities (see Methods). Localities that fall outside the boundaries of these lines are considered mismatched. Below the 85% line (gray) are values of the phenotypic interface wherein garter snakes can consume co-occurring newts with no reduction in performance or fitness. Above the line (orange where no localities are observed) is phenotypic space where toxicity is so high that any snake that ingested a newt would be completely incapacitated or killed.
Figure 4
Figure 4. Representative Interaction Gradients for Localities across the Range of Mismatches
The solid line s-shaped curve is the generalized dose response curve relating whole-snake resistance in snakes to quantity of TTX in mg. The position of this curve on the x-axis (TTX level) varies among localities (thus the lack of scale). The shaded regions correspond to the zones of mismatch evaluated based on phenotypic distributions of predator and prey phenotypes. From each zone (no localities were observed occupying the orange region), interaction gradients are shown for two example localities varying in newt toxicity. Interaction gradients are the linear regression of expected snake performance on individual whole-newt toxicities for a given locality, the slope (β) of which quantifies average potential selection due to the phenotypic interface. Zero or near-zero slope gradients indicate the absence of variance in fitness outcomes and therefore a lack of reciprocal selection. Zero slope localities illustrated include one with very low TTX (Bear Ridge, California), and one with intermediate TTX levels (Omo Road, California). Positive slope localities include one with intermediate (Willits, California) and one with very high TTX levels (Benton, Oregon). The full complement of interaction gradients can be found in Figure S1 and are summarized in Table S1.

Comment in

References

    1. Thompson JN. The geographic mosaic of coevolution. Chicago: University of Chicago Press; 2005. 441
    1. Thompson JN. The coevolutionary process. Chicago: University of Chicago Press; 1994. 376
    1. Thompson JN, Cunningham BM. Geographic structure and dynamics of coevolutionary selection. Nature. 2002;417:735–738. - PubMed
    1. Gomulkiewicz R, Drown DM, Dybdahl MF, Godsoe W, Nuismer SL, et al. Dos and don'ts of testing the geographic mosaic theory of coevolution. Heredity. 2007;98:249–258. - PubMed
    1. Gomulkiewicz R, Thompson JN, Holt RD, Nuismer SL, Hochberg ME. Hot spots, cold spots, and the geographic mosaic theory of coevolution. Am Nat. 2000;156:156–174. - PubMed

Publication types