Review
. 2008 Mar;9(3):174-89.
doi: 10.2174/138945008783755629.

Lipoprotein size and susceptibility to atherosclerosis--insights from genetically modified mouse models

Affiliations
Review

Lipoprotein size and susceptibility to atherosclerosis--insights from genetically modified mouse models

Murielle M Véniant et al. Curr Drug Targets. 2008 Mar.

Abstract

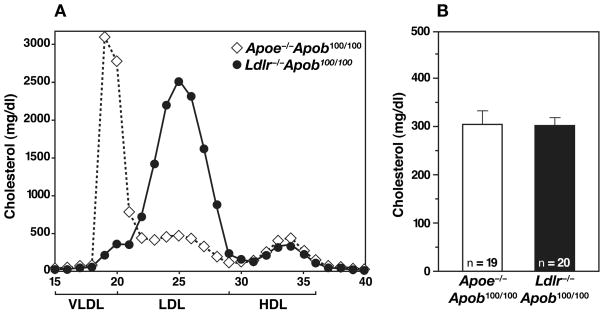
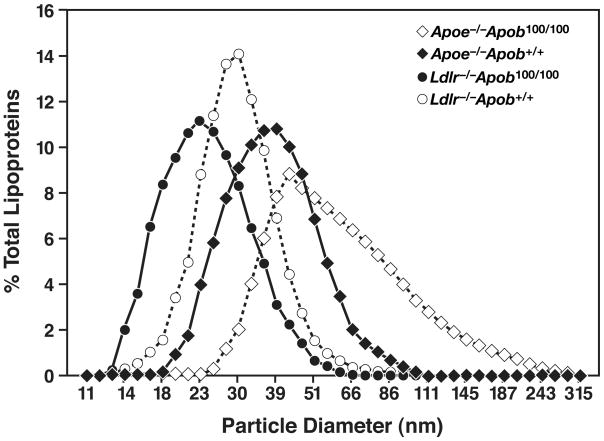
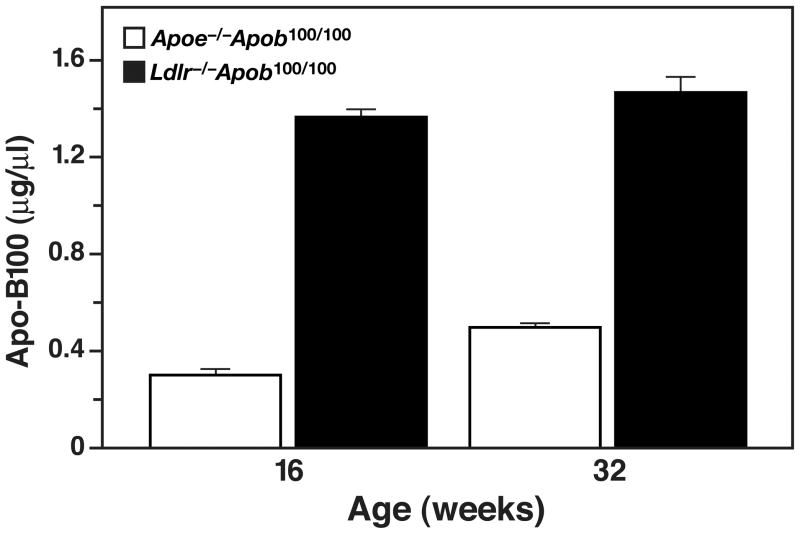
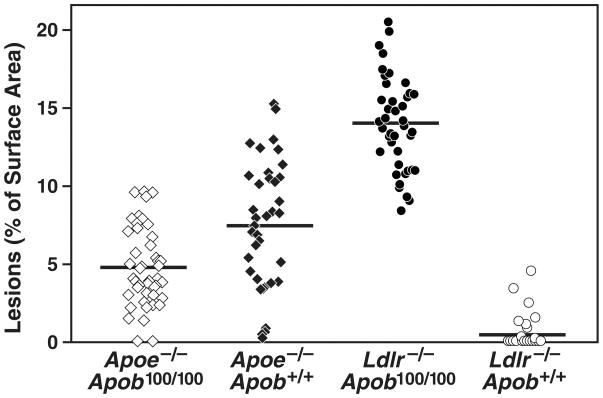
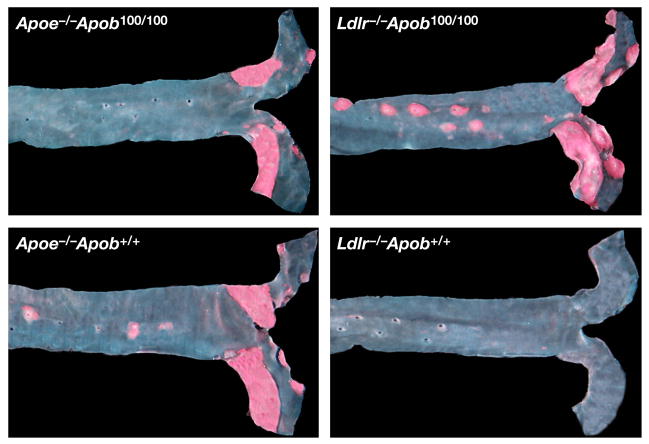
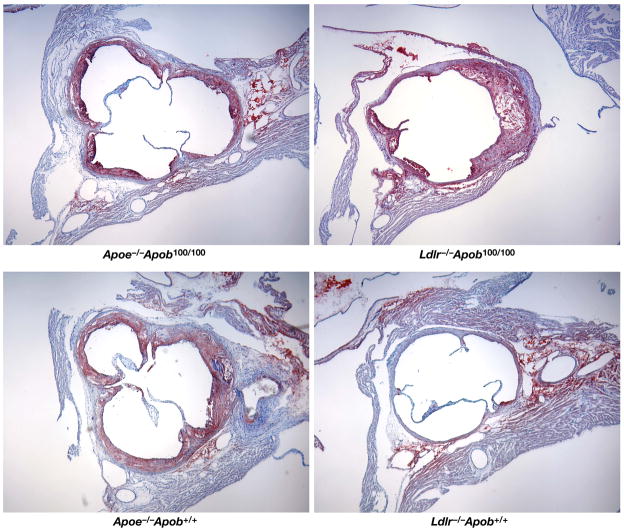
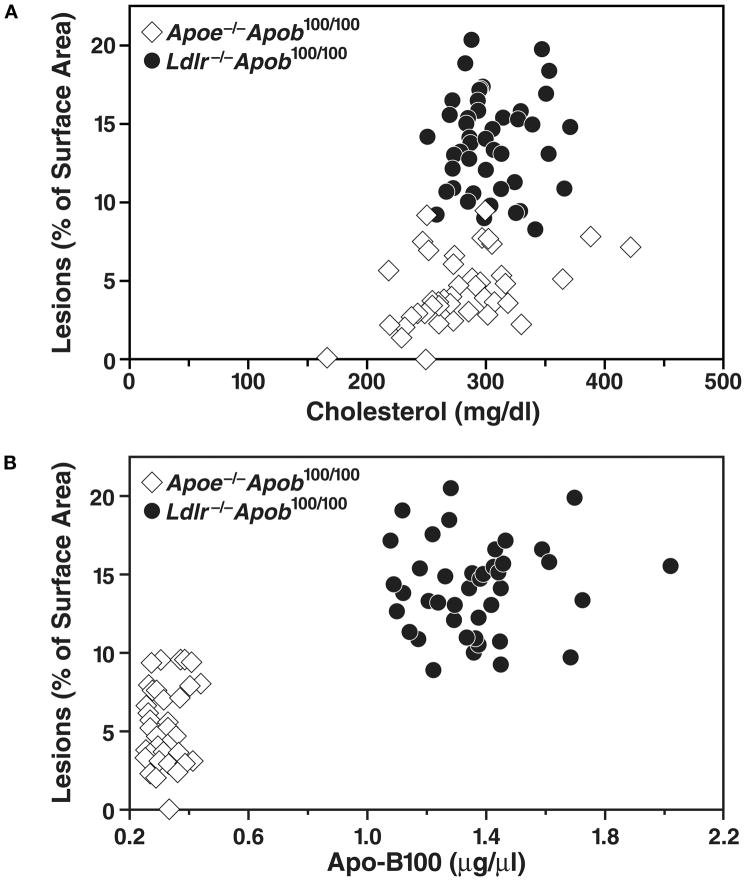
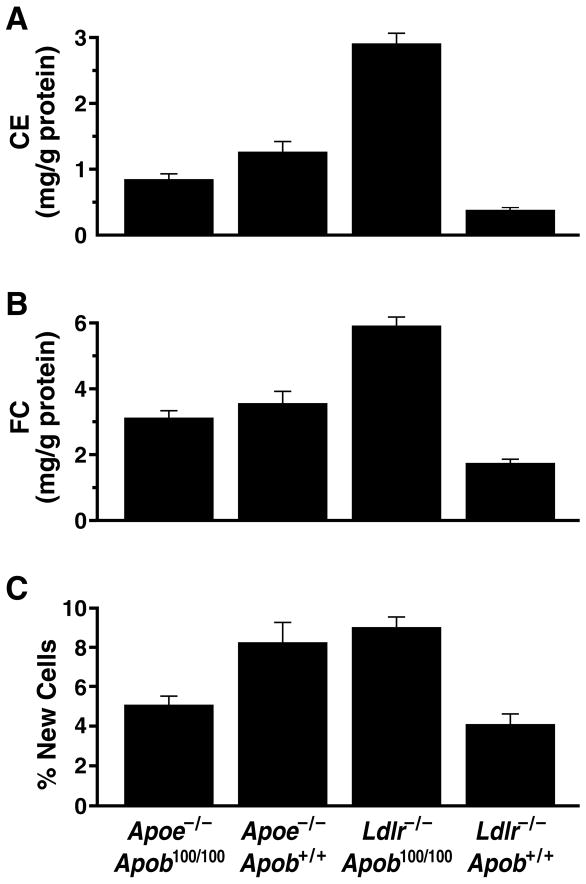
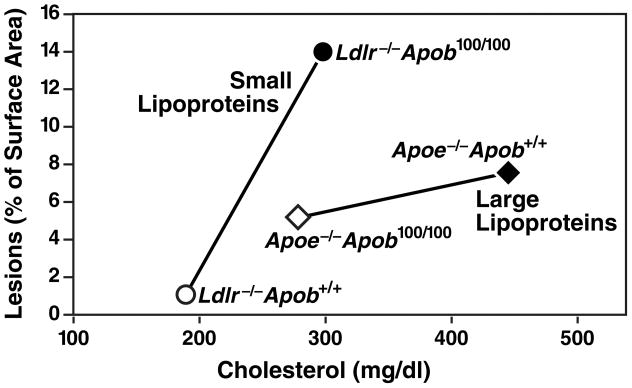
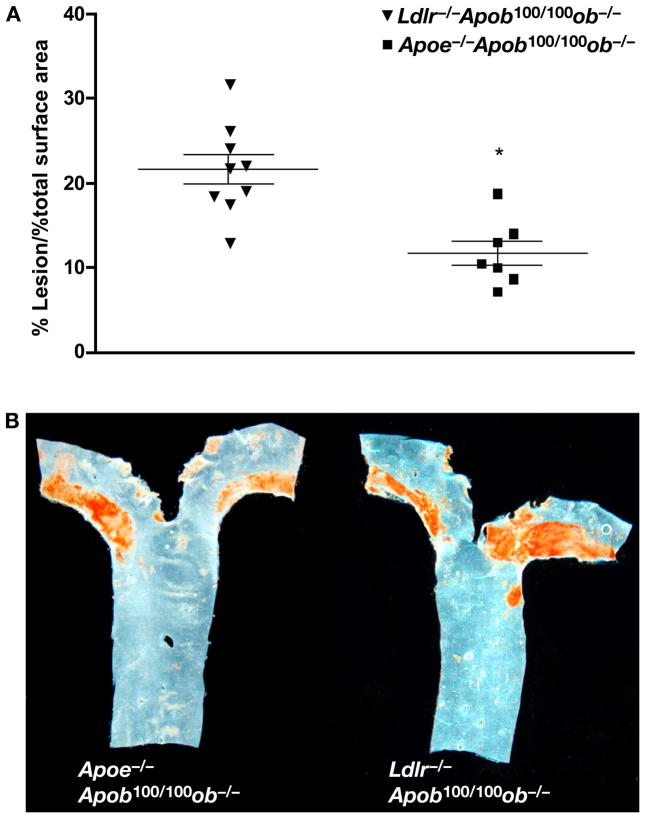
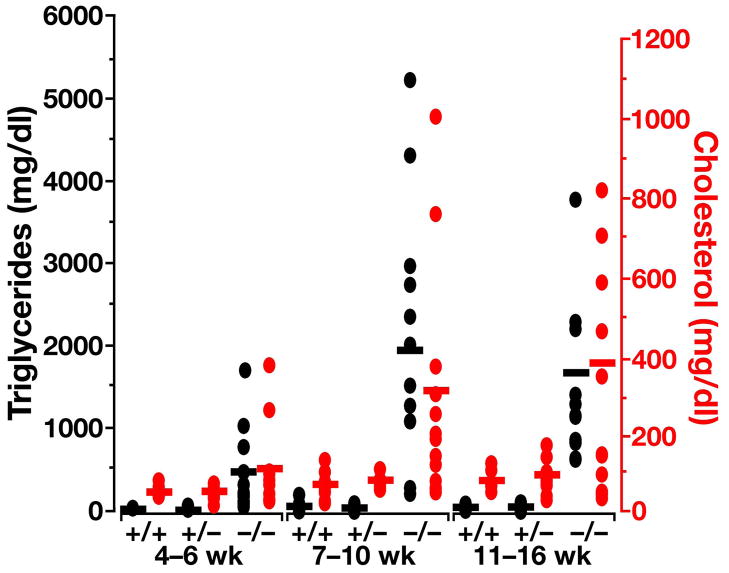
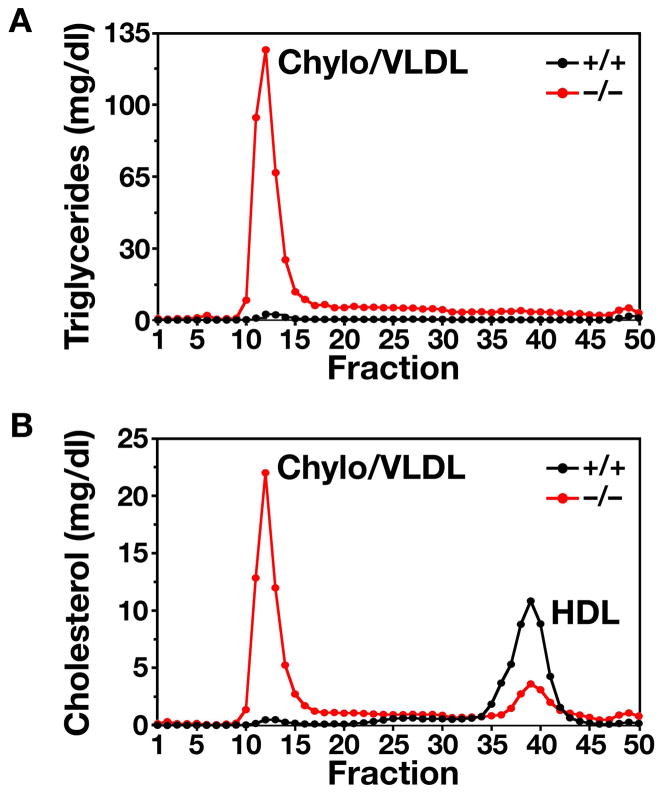
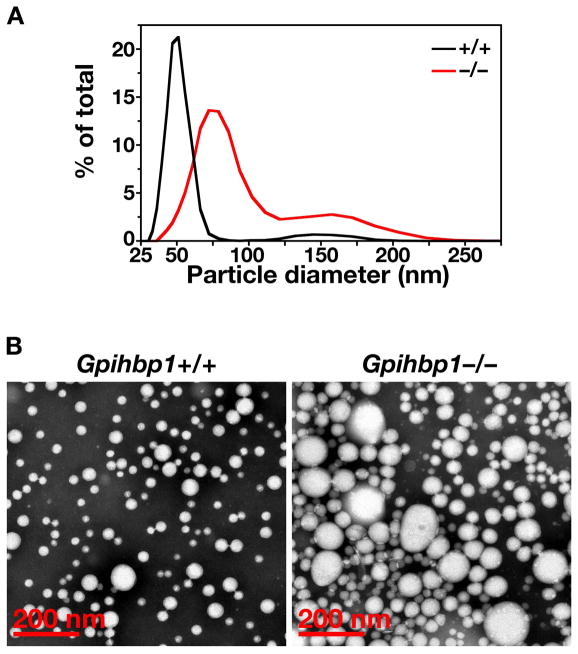
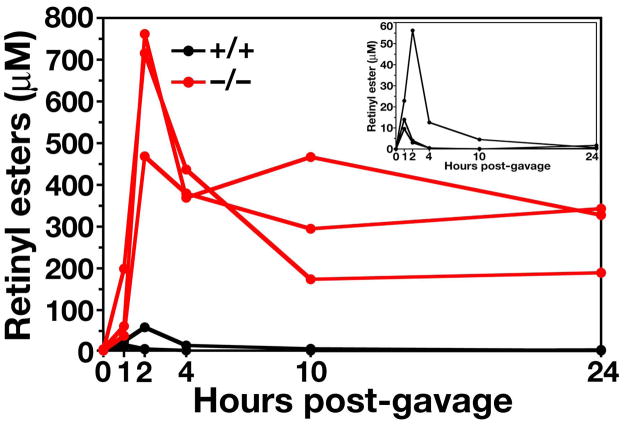
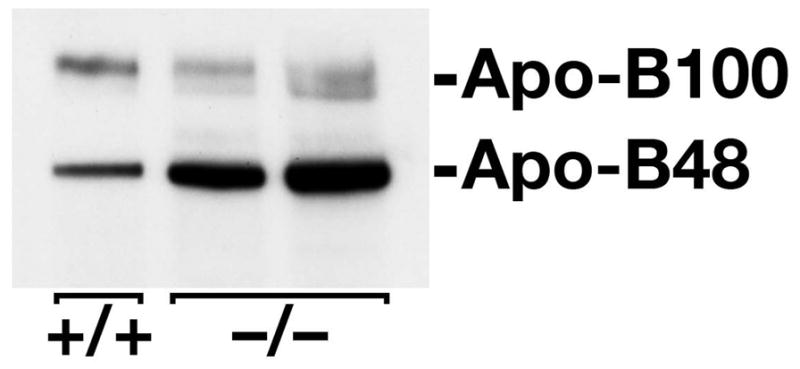
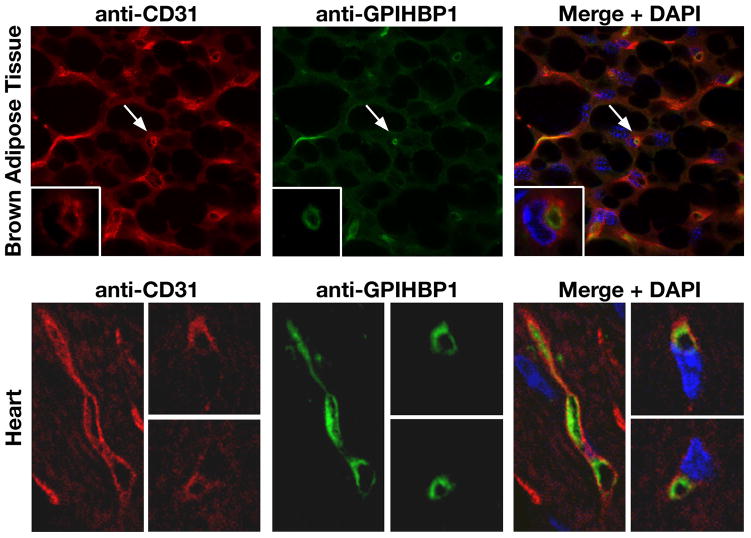
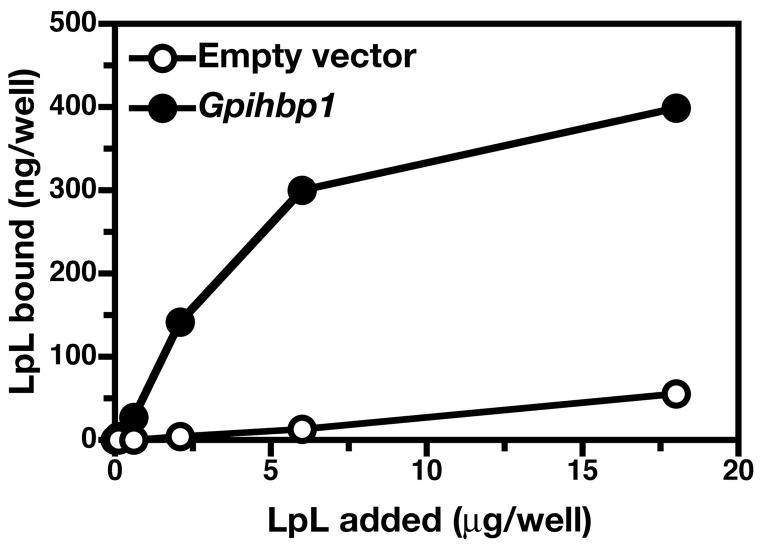
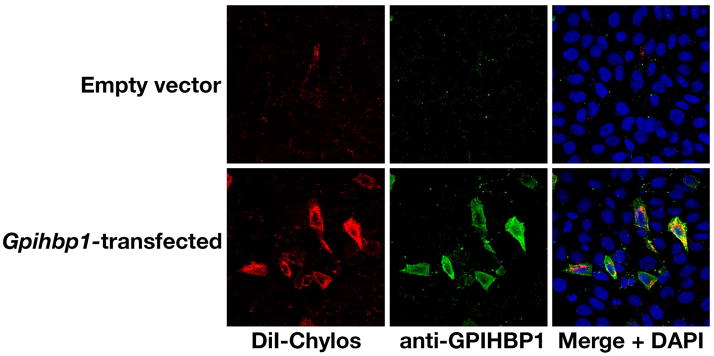
High plasma levels of the apo-B-containing lipoproteins are casually implicated in the pathogenesis of atherosclerosis. This finding, backed by decades of animal and human studies, has sparked interest in defining which classes of apo-B-containing lipoprotein particles are most atherogenic. Although small LDL particles and larger remnant lipoproteins both appear to be atherogenic, it has been difficult to discern which particles are the most atherogenic. Here, we summarize several mouse models that have provided insights into this issue. The influence of lipoprotein size on susceptibility to atherosclerosis was examined by studying the phenotypes of two strains of mice with virtually identical levels of plasma cholesterol--Ldlr(-/-)Apob(100/100) and Apoe(-/-) Apob(100/100) mice. The Ldlr(-/-) Apob(100/100) mice, where the cholesterol is in small LDL particles, had far more atherosclerosis than Apoe(-/-) Apob(100/100) mice, where virtually all of the cholesterol was in larger, VLDL-sized particles. Another intriguing animal model is the Gpihbp1-deficient mouse. GPIHBP1 is an endothelial cell platform for lipolysis, and mice lacking this protein have an accumulation of large, triglyceride-rich lipoproteins. Defining the extent of atherosclerosis in these mice should provide new insights into the atherogenicity of large, triglyceride-rich lipoproteins.


Figures

Figure 1
Figure 1
Lipid and lipoprotein levels in Apoe−/−Apob100/100 (n = 44) and Ldlr−/−Apob100/100 (n = 42) mice. (A) Distribution of cholesterol within different lipoprotein fractions. (B) Mean plasma cholesterol levels in Apoe−/−Apob100/100 (n = 44) and Ldlr−/−Apob100/100 (n = 42) mice at 40 weeks of age. Reproduced from a paper by Véniant et al. (25) with permission from the American Society of Clinical Investigation.
Figure 2
Figure 2
Lipoprotein sizes in Apoe−/−Apob100/100, Ldlr−/−Apob100/100, Ldlr−/−Apob+/+, and Apoe−/−Apob+/+ mice. The median diameter of lipoproteins in Apoe−/−Apob100/100 mice (n = 15) was 140% larger than in Ldlr−/−Apob100/100 (n = 21) mice, 90% larger than in Ldlr−/−Apob+/+ mice (n = 17), and 50% larger than in Apoe−/−Apob+/+ mice (n = 16). The size of VLDL (d < 1.006 g/ml) particles ranged from an average of 33.4 nm in Ldlr−/−Apob100/100 mice to 61 nm in Apoe−/−Apob100/100 mice; the size of IDL (d = 1.006–1.020 g/ml) particles ranged from an average of 27 nm in Ldlr−/−Apob100/100 mice to 38 nm in Apoe−/−Apob100/100 mice; the size of LDL (d = 1.020–1.052 g/ml) particles was 23 nm in Apoe−/−Apob100/100 plasma, 20 nm in Apoe−/−Apob+/+ plasma, 22 nm in Ldlr−/−Apob100/100 plasma, and 19 nm in Ldlr−/−Apob+/+ plasma. The difference in size between the bottom and top deciles of particles was 64.0 nm for Apoe−/−Apob100/100 mice, 27.2 nm for Apoe−/−Apob+/+ mice, 17.8 nm for Ldlr−/−Apob+/+ mice, and 17.0 nm for Ldlr−/−Apob100/100 mice. Reproduced from a paper by Véniant et al. (25) with permission from the American Society of Clinical Investigation.
Figure 3
Figure 3
Apo-B100 levels in Apoe−/−Apob100/100 (n = 36) and Apoe−/−Apob+/+ mice (n = 34) at 16 and 32 weeks of age, as judged by a monoclonal antibody–based radioimmunoassay. Reproduced from a paper by Véniant et al. (25) with permission from the American Society of Clinical Investigation.
Figure 4
Figure 4
Morphometric assessment of atherosclerotic lesions in Apoe−/−Apob100/100 (n = 44), Apoe−/−Apob+/+ (n = 40), Ldlr−/−Apob100/100 (n = 42), and Ldlr−/−Apob+/+ (n = 40) mice. Differences between all groups were significant at the P < 0.0001 level with one exception: the lesions in Apoe−/−Apob+/+ mice were different from those in Apoe−/−Apob100/100 mice at P = 0.0004. Reproduced from a paper by Véniant et al. (25) with permission from the American Society of Clinical Investigation.
Figure 5
Figure 5
Representative Sudan IV–stained thoracic aortas. The amount of atherosclerosis in these four aortas matched the mean level for each genotype of mice. Reproduced from a paper by Véniant et al. (25) with permission from the American Society of Clinical Investigation.
Figure 6
Figure 6
Oil Red O–stained sections of proximal aortic roots for different mouse genotypes. Reproduced from a paper by Véniant et al. (25) with permission from the American Society of Clinical Investigation.
Figure 7
Figure 7
Relationship between atherosclerotic lesions and the total plasma cholesterol levels and plasma apo-B100 levels in Apoe−/−Apob100/100 (n = 41) and Ldlr−/−Apob100/100 (n = 40) mice. The top panel shows a plot of lesions, as assessed by morphometric techniques, versus total plasma cholesterol levels (mean of the five measurements). The bottom panel shows a plot of lesions versus the plasma apo-B100 levels (measured at 32 weeks). Reproduced from a paper by Véniant et al. (25) with permission from the American Society of Clinical Investigation.
Figure 8
Figure 8
Scoring of aortic pathology in the four groups of mice according to the aortic content of free and esterified cholesterol and aortic DNA synthesis rate. (A) Cholesterol ester content of aortas in Apoe−/−Apob100/100 (n = 43), Apoe−/−Apob+/+ (n = 38), Ldlr−/−Apob100/100 (n = 39), and Ldlr−/−Apob+/+ (n = 34) mice. (B) Free cholesterol content of aortas in the four different groups of mice (numbers of mice identical to those for panel A). (C) Aortic DNA synthesis rates in Apoe−/−Apob100/100 (n = 18), Apoe−/−Apob+/+ (n = 17), Ldlr−/−Apob100/100 (n = 25), and Ldlr−/−Apob+/+ (n = 14) mice. Reproduced from a paper by Véniant et al. (25) with permission from the American Society of Clinical Investigation.
Figure 9
Figure 9
Mean extent of atherosclerotic lesions plotted against the mean total plasma cholesterol level. The atherosclerosis data (assessed by morphometric techniques) and the cholesterol data represent means calculated from all of the mice in each group. The steep increase in atherosclerosis in LDL receptor–deficient mice between total cholesterol concentrations of ~200 and ~300 mg/dl suggests that small LDL particles are particularly atherogenic. Reproduced from a paper by Véniant et al. (25) with permission from the American Society of Clinical Investigation.
Figure 10
Figure 10
Body weight in Apoe−/−Apob100/100ob−/− (n = 18–52) and Ldlr−/−Apob100/100 ob−/− (n = 22–52) mice. Body weights were significantly increased in Apoe−/−Apob100/100ob−/− and Ldlr−/−Apob100/100 ob−/− mice compared with wild-type C57BL/6 mice (P < 0.001 for both groups).
Figure 11
Figure 11
Blood glucose and insulin levels in Apoe−/−Apob100/100ob−/− (n = 10–24) and Ldlr−/−Apob100/100 ob−/− (n = 5–17) mice. (A) Fed blood glucose levels were significantly higher in Apoe−/−Apob100/100ob mice than in wild-type C57BL/6 mice (P values at different ages range from 0.05 to 0.001). (B) Fed insulin levels in Apoe−/−Apob100/100ob−/− and Ldlr−/−Apob100/100 ob−/− mice (n = 16–32). ++P < 0.01 vs. Ldlr−/−Apob100/100 ob−/− mice, +++P < 0.001 vs. Ldlr−/−Apob100/100 ob−/− mice, ***P < 0.001 vs. C57BL/6 mice. Shown are means ± SEM.
Figure 12
Figure 12
Plasma lipid levels and lipoprotein profiles in Apoe−/−Apob100/100ob−/− and Ldlr−/−Apob100/100ob−/− mice. (A) Cholesterol levels in Apoe−/−Apob100/100ob−/−, Ldlr−/−Apob100/100 ob−/−, and C57BL/6 mice (n = 7–16). (B) Distribution of cholesterol in the plasma lipoproteins of Apoe−/−Apob100/100ob−/−, Ldlr−/−Apob100/100 ob−/−, and wild-type C57BL/6 mice. A total of 2–5 μl of fresh plasma was used for HPLC-fractionation of the plasma. (C) Triglyceride levels in Apoe−/−Apob100/100ob−/−, Ldlr−/−Apob100/100ob−/−, and C57BL/6 wild-type control mice (n = 7–18).
Figure 13
Figure 13
Atherosclerosis in Apoe−/−Apob100/100ob−/− and Ldlr−/−Apob100/100ob−/− mice. (A) The percentage of the aorta occupied by lesions was quantified in Apoe−/−Apob100/100ob−/− (n = 7) and Ldlr−/−Apob100/100ob−/− mice (n = 13) after 24 weeks on a chow diet. (B) Representative Sudan IV–stained aortas from a Apoe−/−Apob100/100ob−/− mouse and a Ldlr−/−Apob100/100ob−/− mouse.
Figure 14
Figure 14
Plasma samples after low-speed centrifugation. On the right, lipemic plasma from a Gpihbp1-deficient mouse. The two samples on the left were from unaffected littermates. Reproduced, with permission from Elsevier, from the article by Beigneux and coworkers (39).
Figure 15
Figure 15
Plasma triglyceride levels in Gpihbp1+/+, Gpihbp1+/−, and Gpihbp1−/− mice at different ages, showing higher triglyceride levels in Gpihbp1−/− mice (P < 0.0001 for each age group). Lipid levels in Gpihbp1+/+ and Gpihbp1+/− mice were not different. Reproduced, with permission from Elsevier, from the article by Beigneux and coworkers (39).
Figure 16
Figure 16
Distribution of triglyceride and cholesterol in lipoproteins from Gpihbp1−/− mice. (A) Distribution of triglycerides in the plasma lipoproteins of Gpihbp1+/+ and Gpihbp1−/− mice. Plasma lipoproteins were separated by size on a Superose 6 FPLC column. (B) Distribution of cholesterol in the plasma lipoproteins of Gpihbp1+/+ and Gpihbp1−/− mice. Reproduced, with permission from Elsevier, from the article by Beigneux and coworkers (39).
Figure 17
Figure 17
Distribution of lipoprotein diameters in the d < 1.022 g/ml lipoproteins from Gpihbp1−/− and Gpihbp1+/+ mice. (A) As judged by dynamic laser light scattering, the median diameter of lipoproteins was 157% larger in Gpihbp1−/− mice (n = 3) than in Gpihbp1+/+ mice (n = 6). 15.4% of the particles in Gpihbp1−/− mice had diameters of 122–289 nm. The smaller subpopulation of particles in Gpihbp1−/− mice had diameters of 39–111 nm. (B) Electron micrographs of negatively stained d < 1.006 g/ml lipoproteins from the plasma of Gpihbp1−/− and Gpihbp1+/+ mice, showing larger lipoproteins in Gpihbp1−/− mice. Reproduced, with permission from Elsevier, from the article by Beigneux and coworkers (39).
Figure 18
Figure 18
Delayed clearance of retinyl esters in Gpihbp1−/− mice. Retinyl palmitate (5000 IU in 50 μl of vegetable oil) was administered by gavage, and retinyl esters in the plasma were measured over the next 24 h. Inset: retinyl ester levels in Gpihbp1+/+ mice, plotted on a different scale, peaked between 1 and 2 h and had largely disappeared by 10 h. Reproduced, with permission from Elsevier, from the article by Beigneux and coworkers (39).
Figure 19
Figure 19
Western blot of mouse plasma (1.0 μl) with a mouse apo-B–specific monoclonal antibody, showing increased amounts of apo-B48 in the plasma of Gpihbp1−/− mice. Reproduced, with permission from Elsevier, from the article by Beigneux and coworkers (39).
Figure 20
Figure 20
GPIHBP1 is located within the lumen of the capillary endothelium of brown adipose tissue and heart. (A) Confocal microscopy showing the binding of antibodies against CD31 and GPIHBP1 to brown adipose tissue from a Gpihbp1+/+ mouse. Images were taken with a 100× objective. Arrows indicate a capillary shown at higher magnification in the insets (100× objective with 4× digital zoom). Insets: In cross-sections of a capillary, GPIHBP1 staining is particularly prominent on the luminal side. (B) Confocal microscopy showing the binding of antibodies against CD31 and GPIHBP1 to heart tissue from a Gpihbp1+/+ mouse. GPIHBP1 staining is particularly prominent on the luminal face of the capillary endothelium. Images were taken with a 100× objective. Reproduced, with permission from Elsevier, from the article by Beigneux and coworkers (39).
Figure 21
Figure 21
Testing the ability of cell lines expressing GPIHBP1 to bind LpL. (A) Binding of LpL to pgsA-745 CHO cells stably transfected with a cDNA encoding mouse Gpihbp1 or empty vector. Cells were incubated for 2 h with increasing amounts of avian LpL. Bound LpL was analyzed by ELISA. The binding of avian LpL to pgsA-745 CHO cells could be eliminated by treating the cells with a phosphatidylinositol-specific phospholipase C. Reproduced, with permission from Elsevier, from the article by Beigneux and coworkers (39).
Figure 22
Figure 22
Binding of DiI-labeled chylomicrons (red) to nonpermeabilized CHO-ldlA7 cells that had been transiently transfected with a mouse Gpihbp1 cDNA. Binding was measured at 4° C. GPIHBP1 expression was detected with rabbit anti-GPIHBP1 antiserum and FITC-labeled anti-rabbit IgG (green). Reproduced, with permission from Elsevier, from the article by Beigneux and coworkers (39).

Similar articles

Cited by

References

    1. Grundy SM. Cholesterol and coronary heart disease. A new era. J Am Med Assoc. 1986;256:2849–2858. - PubMed
    1. Brown MS, Goldstein JL. A receptor-mediated pathway for cholesterol homeostasis. Science. 1986;232:34–47. - PubMed
    1. NIH Consensus Development Panel. Triglyceride, high-density lipoprotein, and coronary heart disease. J Am Med Assoc. 1993;269:505–510. - PubMed
    1. Feussner G, Wagner A, Kohl B, Ziegler R. Clinical features of type III hyperlipoproteinemia: Analysis of 64 patients. Clin Investig. 1993;71:362–366. - PubMed
    1. Fazio S, Lee Y-L, Ji Z-S, Rall SC., Jr Type III hyperlipoproteinemic phenotype in transgenic mice expressing dysfunctional apolipoprotein E. J Clin Invest. 1993;92:1497–1503. - PMC - PubMed

Publication types