. 2008 May 23;283(21):14524-31.
doi: 10.1074/jbc.M709575200. Epub 2008 Mar 12.

Novel role for STIM1 as a trigger for calcium influx factor production

Affiliations

Novel role for STIM1 as a trigger for calcium influx factor production

Peter Csutora et al. J Biol Chem. .

Abstract

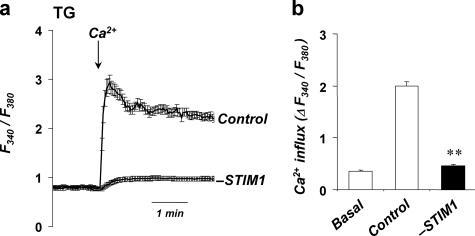
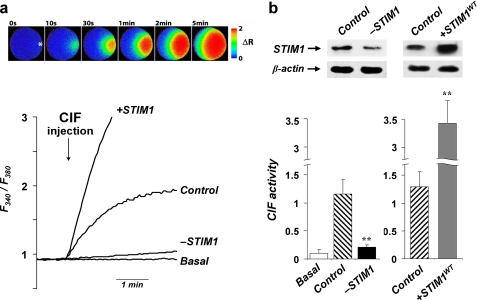
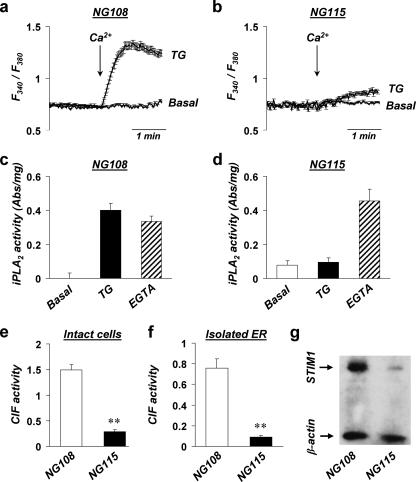
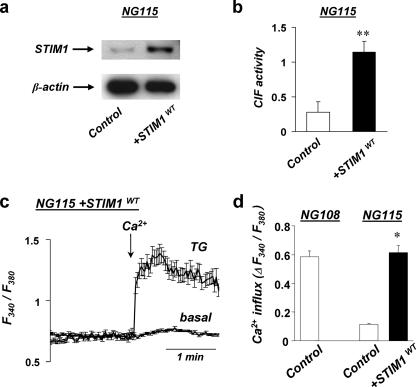
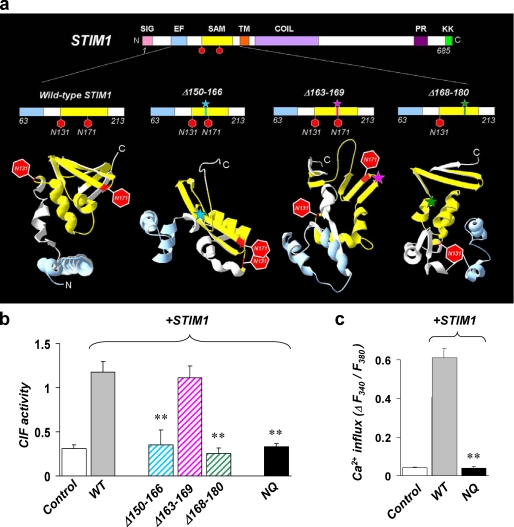
STIM1 has been recently identified as a Ca(2+) sensor in endoplasmic reticulum (ER) and an initiator of the store-operated Ca(2+) entry (SOCE) pathway, but the mechanism of SOCE activation remains controversial. Here we focus on the early ER-delimited steps of the SOCE pathway and demonstrate that STIM1 is critically involved in initiating of production of calcium influx factor (CIF), a diffusible messenger that can deliver the signal from the stores to plasma membrane and activate SOCE. We discovered that CIF production is tightly coupled with STIM1 expression and requires functional integrity of its intraluminal sterile alpha-motif (SAM) domain. We demonstrate that 1) molecular knockdown or overexpression of STIM1 results in corresponding impairment or amplification of CIF production and 2) inherent deficiency in the ER-delimited CIF production and SOCE activation in some cell types can be a result of their deficiency in STIM1 protein; expression of a wild-type STIM1 in such cells was sufficient to fully rescue their ability to produce CIF and SOCE. We found that glycosylation sites in the ER-resident SAM domain of STIM1 are essential for initiation of CIF production. We propose that after STIM1 loses Ca(2+) from EF hand, its intraluminal SAM domain may change conformation, and via glycosylation sites it can interact with and activate CIF-producing machinery. Thus, CIF production appears to be one of the earliest STIM1-dependent events in the ER lumen, and impairment of this process results in impaired SOCE response.


Figures

FIGURE 1.
FIGURE 1.
Down-regulation of STIM1 impairs TG-induced SOCE in smooth muscle cells. a, representative traces show the average changes in intracellular Ca2+ (F340/F380) recorded simultaneously in a number of individual SMC. The cells were pretreated with TG (1 μm) for 5 min in Ca2+-free solution before 2 mm Ca2+ was added (as indicated by the arrow). TG-induced Ca2+ influx (averages ± S.E.) is shown in cells transfected with either scrambled siRNA (Control: n = 31) or siRNA against STIM1 (-STIM1, n = 33). TG-induced Ca2+ release from the stores was similar in both cell types (ΔRatio = 0.028 ± 0.004 in Control; ΔRatio = 0.032 ± 0.007 in -STIM1). b, summary data showing the maximum TG-induced Ca2+ influx in SMC in experiments described in a. Each bar summarizes results 103–215 individual cells from three to five preparations. Basal corresponds to Ca2+ entry in cells treated with 0.5% Me2SO without TG. Please notice that, in contrast with traces in a, the data here show the ΔRatio (±S.E.) values, which were calculated as the difference between the peak F340/F380 ratio after extracellular Ca2+ was added and its level right before Ca2+ addition. The asterisks denote significant differences between control and -STIM1 (p = 0.007).
FIGURE 2.
FIGURE 2.
Down-regulation of STIM1 impairs CIF production in smooth muscle cells. a, top panel shows pseudocolored ratiometric images demonstrating Ca2+ entry in a Xenopus oocyte (∼1-mm diameter) pre-loaded with fura-2 following injection of 28 nl of active CIF extract (prepared from TG-treated SMC transfected with scrambled siRNA). The asterisk in the first frame denotes the point of injection. Representative traces below show the changes in intracellular Ca2+ (F340/F380) in individual oocytes following injection of CIF extracts from untreated SMC (Basal), or TG-treated SMC transfected with either scrambled siRNA (Control), siRNA against STIM1 (-STIM1), or wild-type STIM1 construct (+STIM1WT). b, representative Western blots (on the top) show that SMC transfection with STIM1 siRNA (-STIM1, left blot) resulted in about 50% (48 ± 5%) reduction in STIM1 protein expression, whereas transient overexpression of wild-type STIM1 (+STIM1WT, right blot) increased protein levels to 264 ± 34% compared with controls. The bar graphs below compare the activity of CIF extracts (maximum ΔRatio ± S.E., as measured in the assay shown in c) obtained from SMC with different levels of STIM1 expression. The left panel shows the activity of CIF extracts from untreated SMC (Basal) and TG-treated SMC transfected with either scrambled siRNA (Control) or siRNA against STIM1 (-STIM1). The right panel shows the activity of CIF from TG-treated SMC transfected with either no DNA (Control), or STIM1 construct (+STIM1WT). Each bar summarizes results from seven to seventeen oocytes injected with extracts obtained from three or four different preparations of SMC for each condition. The asterisks denote significant differences between -STIM1 and its control (p = 0.003) and between +STIMWT and its control (p < 0.001), respectively.
FIGURE 3.
FIGURE 3.
Differences in SOCE (a and b), iPLA2β activity (c and d), CIF production (e), and STIM1 expression (f) in the neuronal cell lines NG108 and NG115. a and b, representative traces show the average changes (±S.E.) in intracellular Ca2+ (F340/F380) recorded simultaneously in a number of individual NG108 (a) and NG115 (b) cells. The cells were pretreated with TG (TG, 1 μm, n = 40 for NG108, n = 41 for NG115) or with 0.5% Me2SO (Basal, n = 31 for NG108, n = 37 for NG115) for 5 min in Ca2+-free solution before 2 mm Ca2+ was added (indicated by the arrows). c and d, summary data showing the activity of iPLA2 (absorbance/mg of protein) in the homogenates of NG108 (c) and NG115 (d) cells with no treatment (Basal), with TG treatment before homogenization (TG, 1 μm for 5 min), or with EGTA treatment (EGTA, 10 mm for 5 min) after homogenization (as a control for the ability of iPLA2 to get activated independently of store depletion). A summary of four to eight measurements from three different cultures of NG108 and NG115 cells is shown. e, summary bar graphs show the activity of CIF extracts from TG-treated NG108 and NG115 cells, which were tested in experiments similar to those shown in Fig. 1c. CIF was extracted from five different cultures of NG108 and seven cultures of NG115. The asterisks denote significant differences between the CIF activity of NG108 and NG115 cells (p < 0.001). f, bar graph shows the activity of CIF extracted from isolated ER vesicles from NG108 and NG115 cells. Depletion of Ca2+ from isolated ER vesicles was done by their treatment with TG, as described under “Materials and Methods.” CIF activity was tested in experiments similar to those shown in Fig. 2a. Each bar summarizes the results from four to seven oocyte injections with CIF obtained from three similar ER preparations. g, representative Western blot shows that NG115 cells contain only 11 ± 4% of STIM1 protein compared with NG108 cells.
FIGURE 4.
FIGURE 4.
Expression of exogenous STIM1 restores CIF production and SOCE in deficient NG115 cells. a, representative Western blot shows >10-fold increase in the amount of STIM1 protein in NG115 cells transfected with exogenous STIM1 (+STIM1WT) compared with cells transfected with empty vector (Control). b, bar graph shows the activity of CIF extracts from TG-treated NG115 cells transfected with either empty vector (Control) or with STIM1 (+STIM1WT), which were tested in experiments similar to those shown in Fig. 2. Summary from seven to nine oocyte injections of CIF extracts from three different cultures of control and +STIM1WT cells. The asterisks denote significant difference (p = 0.003). c, representative traces show the average changes (±S.E.) in intracellular Ca2+ (F340/F380) recorded simultaneously in a number of individual NG115 cells in which exogenous STIM1 was expressed (+STIM1WT). The cells were pretreated with TG (TG, 1 μm, n = 38) or with 0.5% Me2SO (Basal, n = 50) for 5 min in Ca2+-free solution before 2 mm Ca2+ was added (as indicated by the arrow). d, summary data from experiments in Figs. 3(a and b) and 4c. Maximum SOCE in control NG108 cells (n = 230 from four cultures), control NG115 cells (n = 215 from four cultures), and in NG115 cells expressing exogenous STIM1 (+STIM1WT) (n = 92 from three different cultures). The asterisk denotes significant differences between control NG115 and +STIM1WT NG115 cells (p < 0.001).
FIGURE 5.
FIGURE 5.
Exogenously expressed YFP-STIM1 is able to form puncta in deficient NG115 cells. Live fluorescent images of representative NG115 cells expressing YFP-STIM1, before (upper panels) and after (lower panels) TG treatment (1 μm, 5 min). The images on the left show the bottom plane, and those on the right the middle plane (4.5 μm from the bottom) of the same cells. The histograms on the right show fluorescence intensities in cross-section of the cells (as indicated by the rectangles) before and after TG application. The entire deconvolved z stack is presented in supplemental Fig. S2. Translocation of YFP-STIM1 in NG115 cells in time is also shown in supplemental Fig. S3 and the supplemental movie.
FIGURE 6.
FIGURE 6.
The time course of CIF production and puncta formation. The average time courses of puncta formation in NG115 cells expressing YFP-STIM1 (puncta) and CIF production (CIF) in Jurkat T-lymphocytes following application of TG. The images of NG115 cells were analyzed using ImageJ program (the particle analysis function) after the convolve filter application. The number of puncta was normalized and plotted against time. Each point shows the means ± S.E. from several experiments. The most sensitive detection of early CIF production was achieved using Jurkat cells (∼200 million cells/each time point, repeated in three different cell preparations).
FIGURE 7.
FIGURE 7.
Molecular requirements for STIM1 function as a trigger for CIF production: the role of SAM domain and glycosylation sites. a, the location of three mutations (deletions) within SAM domain of STIM1 and their effects on the predicted tertiary structure and the orientation of the Asn131 and Asn171 glycosylation sites. Structural modeling of the intraluminal EF-hand-SAM domain part of STIM1 was performed on wild-type STIM1 and on mutant STIM1 constructs in which amino acids 150–166 (Δ150–166), 163–169 (Δ163–169), or 168–180 (Δ168–180) had been deleted by site-directed mutagenesis (see “Materials and Methods” for details). The Asn131 and Asn171 glycosylation sites are shown as red hexagons. Color-coded asterisks indicate the location of the specific deletions in the sequence and structure of the mutant SAM domains. b, bar graph shows the activity of CIF extracts from TG-treated (1 μm, 5 min) NG115 cells transfected with either empty vector (Control), wild-type STIM1 (WT), deletion mutant STIM1 constructs (Δ150–166, Δ163–169, or Δ168–180), or with a mutant STIM1 in which both glycosylation sites were mutated from asparagine to glutamine (N131Q and N171Q, shown as NQ). The bars summarize the result from four to eleven oocyte injections with CIF obtained from two or three different cultures of transfected NG115 cells. The asterisks denote significant differences between WT and Δ150–166 (p = 0.011), WT and Δ168–180 (p < 0.001), and WT and NQ (p = 0.002), respectively. c, summary data showing the maximum TG-induced Ca2+ influx in NG115 cell transfected with either no DNA (Control), with wild-type STIM1 (WT), or with the double-glycosylation mutant STIM1 (N131Q and N171Q, shown as NQ, and described in b). Each bar summarizes results from 47–142 NG115 cells from three different transfections. The asterisks denote significant differences between WT and NQ (p = 0.014).

Similar articles

Cited by

References

    1. Parekh, A. B., and Putney, J. W., Jr. (2005) Physiol. Rev. 85 757-810 - PubMed
    1. Lewis, R. S. (2007) Nature 446 284-287 - PubMed
    1. Liou, J., Kim, M. L., Heo, W. D., Jones, J. T., Myers, J. W., Ferrell, J. E., Jr., and Meyer, T. (2005) Curr. Biol. 15 1235-1241 - PMC - PubMed
    1. Mercer, J. C., Dehaven, W. I., Smyth, J. T., Wedel, B., Boyles, R. R., Bird, G. S., and Putney, J. W., Jr. (2006) J. Biol. Chem. 281 24979-24990 - PMC - PubMed
    1. Wu, M. M., Buchanan, J., Luik, R. M., and Lewis, R. S. (2006) J. Cell Biol. 174 803-813 - PMC - PubMed

Publication types