. 2008 May 9;283(19):12819-30.
doi: 10.1074/jbc.M709936200. Epub 2008 Mar 12.

A new small molecule inhibitor of estrogen receptor alpha binding to estrogen response elements blocks estrogen-dependent growth of cancer cells

Affiliations

A new small molecule inhibitor of estrogen receptor alpha binding to estrogen response elements blocks estrogen-dependent growth of cancer cells

Chengjian Mao et al. J Biol Chem. .

Abstract

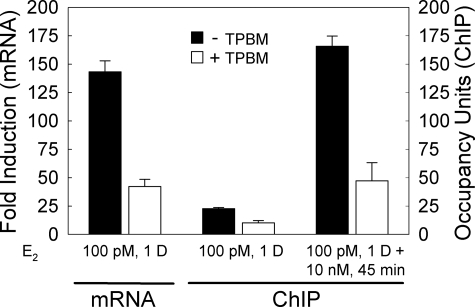
Estrogen receptor alpha (ERalpha) plays an important role in several human cancers. Most current ERalpha antagonists bind in the receptor ligand binding pocket and compete for binding with estrogenic ligands. Instead of the traditional approach of targeting estrogen binding to ER, we describe a strategy using a high throughput fluorescence anisotropy microplate assay to identify small molecule inhibitors of ERalpha binding to consensus estrogen response element (cERE) DNA. We identified small molecule inhibitors of ERalpha binding to the fluorescein-labeled (fl)cERE and evaluated their specificity, potency, and efficacy. One small molecule, theophylline, 8-[(benzylthio)methyl]-(7CI,8CI) (TPBM), inhibited ERalpha binding to the flcERE (IC(50) approximately 3 microm) and inhibited ERalpha-mediated transcription of a stably transfected ERE-containing reporter gene. Inhibition by TPBM was ER-specific, because progesterone and glucocorticoid receptor transcriptional activity were not significantly inhibited. In tamoxifen-resistant breast cancer cells that overexpress ERalpha, TPBM inhibited 17beta-estradiol (E(2))-ERalpha (IC(50) 9 microm) and 4-hydroxytamoxifen-ERalpha-mediated gene expression. Chromatin immunoprecipitation showed TPBM reduced E(2).ERalpha recruitment to an endogenous estrogen-responsive gene. TPBM inhibited E(2)-dependent growth of ERalpha-positive cancer cells (IC(50) of 5 microm). TPBM is not toxic to cells and does not affect estrogen-independent cell growth. TPBM acts outside of the ER ligand binding pocket, does not act by chelating the zinc in ER zinc fingers, and differs from known ERalpha inhibitors. Using a simple high throughput screen for inhibitors of ERalpha binding to the cERE, a small molecule inhibitor has been identified that selectively inhibits ERalpha-mediated gene expression and estrogen-dependent growth of cancer cells.


Figures

FIGURE 1.
FIGURE 1.
A 384-well plate FAMA for 10-μl volumes. FAMA was carried out in samples containing 100 nm E2 as described under “Experimental Procedures” in 384-well black wall microplates using either the standard 20-μl volume (filled circles) or the 10-μl volume used in the final HTS screen (open circles). Data represent the average increase in anisotropy observed after E2·ERα binding to the flcERE. Data represent the mean ± S.E. for four separate experiments.
FIGURE 2.
FIGURE 2.
Scheme for identification and characterization of small molecule inhibitors of ERα action in ER-dependent cancer cells. Our strategy for identification of ERα antagonists included the following assays. (i) In vitro FAMA assays using purified proteins and DNA to carry out the HTS screen and to further characterize the verified hits for potency, efficacy, and specificity. (ii) Cell-based gene expression assays to determine potency and efficacy and to evaluate specificity using assays for PR- and GR-regulated gene expression. (iii) Cell growth assays for evaluating ability of the final candidates to block estrogen-dependent growth of cancer cells and for their generalized toxicity in ERα-negative cancer cells. (iv) Testing inhibitor potency and efficacy against an endogenous gene in Tam-resistant breast cancer cells. (v) Early studies to test known sites of ERα inhibitor action.
FIGURE 3.
FIGURE 3.
Dose-response curves for inhibition of ERα, PR, and AR binding to their HREs. A, the structures of the six compounds whose binding curves are shown in B. B, dose-response curves for ERα-selective and non-selective inhibitors identified in the primary HTS screen. The indicated concentrations of each small molecule were incubated with ERα (filled circles), AR (open triangles), and PR (filled squares) using the sequential method described under “Experimental Procedures.” The anisotropy change on binding of each receptor to its respective response element was set equal to 100%. These anisotropy changes were: ERα ∼35 mA units, PR ∼90 mA units, and AR ∼60 mA units. Because AR and PR are larger than ER, their binding to their HREs results in larger anisotropy changes. The data for compound TPBM/95910 represent a separate set of experiments from the data used to compile Table 1. The data represent the mean ± S.E. for four separate experiments at each concentration.
FIGURE 4.
FIGURE 4.
Effect of small molecules on ER-mediated gene expression in T47DKBluc cells. A, E2 dose-response curve. The cells were maintained in medium containing either 1 nm ICI 182,780 (to test for traces of estrogens in the medium), or the indicated concentrations of E2 and reporter gene expression was assayed after 24 h. The data represent the average of three independent experiments ± S.E. B, inhibition of ERα-mediated gene expression by small molecules that inhibit binding of ERα to the ERE. Small molecules identified in the FAMA HTS screen, verified and further characterized for potency and specificity, were tested. Cells were incubated in medium containing 30 μm inhibitor for 30 min, then 20 pm E2 (A) was added, and the cells were incubated for an additional 24 h. Control experiments demonstrated that the DMSO used to dissolve the small molecules and the ethanol used to dissolve the E2, separately and in combination, did not alter gene expression or reduce cell viability (data not shown). Data in B represent single experiments. C, dose-response curves for small molecules that inhibit ER-mediated gene expression. Assays were as described in B. In control experiments the cells were maintained for 24 h in medium containing 20 pm E2, with or without 1 nm of ICI 182,780 or OHT. The indicated concentrations of each small molecule were incubated with the cells and E2·ER-mediated gene expression assayed. The data represent the mean ± S.E. for four separate experiments at each concentration. IC50 values were obtained by curve-fitting using Sigma plot and had a high R2 value.
FIGURE 5.
FIGURE 5.
Effect of ERα inhibitors on GR- and PR-mediated gene expression in T47D cells. Assays were performed essentially as described for ER in the legend to Fig. 4 (A and B). The indicated concentration of each small molecule was incubated with the cells for 30 min followed by addition of 2.5 nm dexamethasone to assay GR transactivation (A) or 5 nm progesterone to assay PR transactivation (B). After 24 h, luciferase activity was measured. The data represent the mean ± S.E. for four separate experiments at each concentration.
FIGURE 6.
FIGURE 6.
Small molecule inhibitors of ER-mediated gene expression block estrogen-dependent growth of cancer cells. A, BG-1 ovarian cancer cells were maintained in medium lacking E2 (gray bars), or containing 10 pm E2 (black bars). OHT and ICI were at 1 nm. The cells were maintained for 5 days in the presence of the indicated concentrations of TPBM/95910 or 1529 as described under “Experimental Procedures,” and viable cells were determined using the cell titer Aqueous one solution cell proliferation assay. B, ERα-negative MDA-MB-231 cells were maintained in medium containing no E2 (gray bars) or 10 pm E2 (black bars). OHT and ICI were at 1 nm. The cells were maintained for 5 days in the indicated concentrations of TPBM/95910 and 1529, and viability was assayed as described using the cell titer Aqueous one solution cell proliferation assay. Cell plating and assays are described under “Experimental Procedures.” The data represent the mean ± S.E. for four separate experiments at each concentration. The IC50 for TPBM/95910 was obtained by curve-fitting using Sigma plot and had a high R2 value.
FIGURE 7.
FIGURE 7.
TPBM inhibits E2- and OHT-mediated gene expression in a Tam-resistant cell line. MCF7ERαHA cells were maintained in 10% 6× charcoal-stripped fetal bovine serum, treated with 0.5 μg/ml Dox to induce ERα and 100 pm E2 (A) or 500 pm OHT (B) and the indicated concentrations of 95910 for 24 h. The cells were harvested, and PI-9 mRNA levels were determined by quantitative reverse transcription-PCR as described under “Experimental Procedures.” The high level of ERα in Dox-treated cells (E2– and Dox+) results in some ligand-independent transactivation of PI-9 by ERα. The data represent the mean ± S.E. for three separate experiments each assayed in triplicate. The IC50 of 8.5 μm for TPBM/95910 inhibition of E2 induction of PI-9 was obtained by curve-fitting using Sigma plot and had a high R2 value. C, Western blot analysis of ERα levels in MCF7ERαHA cells in the presence and absence of Dox. MCF7ERαHA cells were maintained in medium containing or lacking 0.5 μg/ml Dox and no ligand, 100 pm E2, or 500 pm OHT. The cells were harvested after 24 h, and total cell extracts were prepared and analyzed for ERα content by Western blot as described under “Experimental Procedures.” To better visualize the differences in ERα levels in the uninduced and Dox-induced MCF7ERαHA cells 30 μg (3× more protein) was run for each uninduced sample, and 10 μg of protein was run for each sample from MCF7ERαHA cells in which ERα was induced with Dox. ERα antibody was used at a dilution of 1:2,000. Relative levels of ERα were calculated by PhosphorImager quantitation of band intensity and normalization to actin (actin antibody was a 1:10,000 dilution). The ratio of unliganded (–E2 and –OHT)ERα to actin in the MCF7ERαHA cells not treated with Dox to induce ERα was set equal to 1. The ratios of ERα levels in the Dox-treated and uninduced (–Dox) MCF7ERαHA cells were 3.7, 3.1, and 4.0 for cells maintained in medium with no ligand, E2, and OHT, respectively. The data in C are representative of other Western blots.
FIGURE 8.
FIGURE 8.
ChIP demonstrates that TPBM decreases binding of E2·ERα to an estrogen-regulated gene. MCF7ERαHA cells were maintained for 24 h as described in the legend to Fig. 7A and used either for determination of PI-9 mRNA levels as described in “Experimental Procedures,” or for ChIP (44) and as described in “Experimental Procedures.” The MCF7ERαHA cells were maintained in medium containing 100 pm E2 for 24 h in the absence (black bars) or presence (open bars) of 20 μm TPBM. In one ChIP, additional 10 nm E2 was added 45 min. before cross-linking the cells. The mRNA data is presented as -fold induction by E2, with the level of PI-9 mRNA in control cells not treated with E2 or Dox set equal to 1. The mRNA data represent the mean ± S.E. for three separate experiments. The extent of association of E2·ERα with the PI-9 ERU in the presence of E2 or E2 plus 20 μm TPBM is presented in ChIP occupancy units normalized to 36B4 as a non-regulated gene (44). The ChIP data represent the average ± S.E. of three assays. Decreased E2·ERα occupancy of the PI-9 in cells maintained in E2 plus 20 μm TPBM was observed in multiple ChIP experiments. The difference between samples treated with E2 and samples treated with E2 plus 20 μm TPBM was highly significant (p < 0.01 using the one-tailed Student's t test) for the mRNA induction and for both of the ChIPs. The robust nature of both ChIP experiments is demonstrated by the >25-fold increase in ChIP occupancy units in E2-treated cells compared with control (–E2 and –Dox) cells.
FIGURE 9.
FIGURE 9.
High concentrations of E2 do not reduce the ability of TPBM to inhibit binding of E2·ERα to the flcERE. Assays were carried out essentially as described in the legend to Fig. 3 and under “Experimental Procedures.” E2 was present at the standard concentration of 100 nm (open circles) or at 10 μm (closed circles). The anisotropy change in the absence of inhibitor was set equal to 100%. The data represent the mean ± S.E. for four separate experiments. Error bars that are not visible are smaller than the symbols.

Similar articles

Cited by

References

    1. Clarke, R., Liu, M. C., Bouker, K. B., Gu, Z., Lee, R. Y., Zhu, Y., Skaar, T. C., Gomez, B., O'Brien, K., Wang, Y., and Hilakivi-Clarke, L. A. (2003) Oncogene 22 7316–7339 - PubMed
    1. Jiang, X., Ellison, S. J., Alarid, E. T., and Shapiro, D. J. (2007) Oncogene 26 4106–4114 - PubMed
    1. Jiang, X., Orr, B. A., Kranz, D. M., and Shapiro, D. J. (2006) Endocrinology 147 1419–1426 - PubMed
    1. O'Lone, R., Frith, M. C., Karlsson, E. K., and Hansen, U. (2004) Mol. Endocrinol. 18 1859–1875 - PubMed
    1. Gradishar, W. J., and Cella, D. (2006) JAMA 295 2784–2786 - PubMed

Publication types

MeSH terms