Comparative Study
. 2008 Mar 12;28(11):2766-72.
doi: 10.1523/JNEUROSCI.5548-07.2008.

A role for non-rapid-eye-movement sleep homeostasis in perceptual learning

Affiliations
Comparative Study

A role for non-rapid-eye-movement sleep homeostasis in perceptual learning

Daniel Aeschbach et al. J Neurosci. .

Abstract

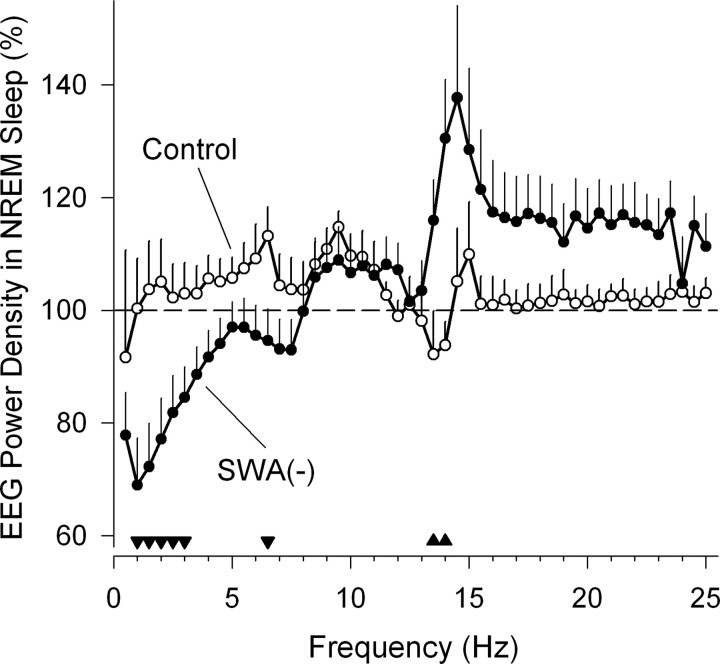
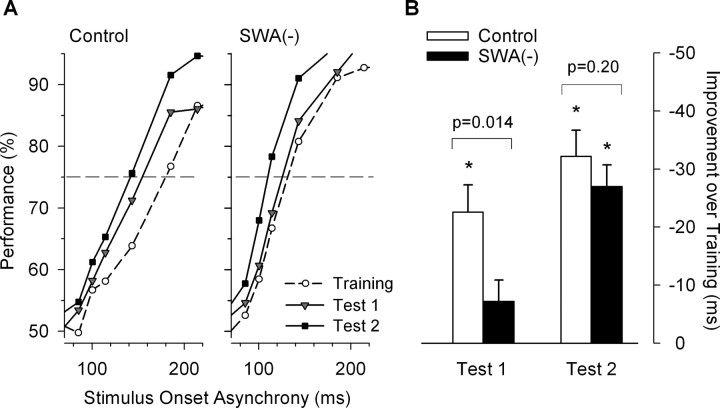
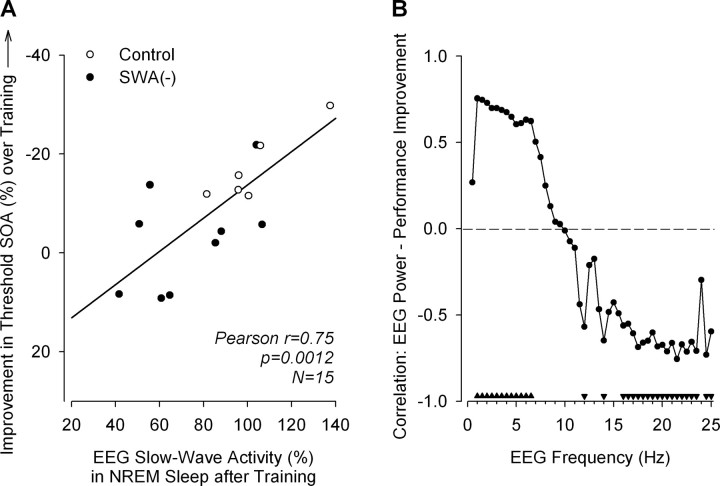
Slow-wave activity (SWA; EEG power density in the 0.75-4.5 Hz range) in non-rapid-eye-movement (NREM) sleep is the primary marker of sleep homeostasis and thought to reflect sleep need. But it is unknown whether the generation of SWA itself serves a fundamental function. Previously, SWA has been implicated in brain plasticity and learning, yet the evidence for a causal role remains correlative. Here, we used acoustic slow-wave suppression to test whether overnight improvement in visual texture discrimination, a form of perceptual learning, directly depends on SWA during sleep. Two groups of subjects were trained on a texture discrimination task (TDT) after baseline sleep, and were tested 24 h later, after a 4 h experimental (EX) sleep episode (with or without SWA suppression), and again after a night of recovery sleep. In the suppression group, SWA during EX sleep was reduced by 30% compared with the control group, whereas total sleep time and REM sleep were not affected. Texture discrimination improved after EX sleep in the control group but not in the suppression group. Moreover, overnight improvement in TDT performance correlated with EEG power density during NREM sleep in the frequency range of SWA (maximum r = 0.75 at 0.75-1.0 Hz) over brain areas involved in TDT learning. We conclude that SWA is an important determinant of sleep-dependent gains in perceptual performance, a finding that directly implicates processes of sleep homeostasis in learning.


Figures

Figure 1.
Figure 1.
Effect of acoustic slow-wave suppression on EEG power density during NREM sleep over right occipitoparietal cortex (O2/P4). Data in the slow-wave activity suppression group, SWA(−), and the control group are expressed as a percentage of power density in first 4 h of an 8 h baseline sleep episode. Data represent means + SEM [n = 9 for SWA(−) and n = 6 for control, except for frequencies >15 Hz, for which n = 5 because of removal of power densities contaminated by high-frequency noise at P4 in one subject]. Filled triangles above abscissa indicate 0.5 Hz frequency bins for which differences between groups were significant (p < 0.05, unpaired t tests on log-transformed values). Power densities and significance are plotted at upper limit of 0.5 Hz frequency bins (e.g., value plotted at 1.0 Hz corresponds to average of power densities at 0.75 and 1.0 Hz).
Figure 2.
Figure 2.
Effects of slow-wave suppression during sleep on learning of a visual discrimination skill. Two groups of subjects were trained on a visual TDT, and were tested 24 h later after a 4 h EX sleep episode during test 1, and again after an 8 h recovery sleep episode during test 2. In one group, slow-wave activity was suppressed during EX sleep with sounds [SWA(−)], whereas no sounds were presented in the control group. A, Performance on the TDT at various stimulus-to-mask-onset asynchronies (SOA, i.e., interval between onset of stimulus and mask). Data represent means (performance for SOAs >220 and <70 ms are not shown). Dashed horizontal lines indicate a 75% performance level which was used to determine the threshold SOA in B. B, Improvement of discrimination skill (i.e., learning) as measured by the decrease in the threshold SOA in test 1 and test 2 compared with training. Threshold SOAs were determined through linear interpolation. Bars represent means + SEM [n = 9 for SWA(−) group, and n = 6 for control group] that were adjusted for influence of each individual's absolute threshold SOA during training session on the improvements after training. Adjustment was performed by ANCOVA with absolute threshold SOA during training as covariate (see Materials and Methods). Asterisks denote significant improvements in threshold SOA (p < 0.0004 in all cases, two-sided paired t test). Improvement in test 1 was smaller in SWA(−) group than in control group as indicated by the p value (one-sided unpaired t test).
Figure 3.
Figure 3.
Visual attention in the slow-wave suppression group, SWA(−), and the control group. Attention was measured as the percentage of correct letter identifications (L or T) in a dual task that included central letter identification and peripheral texture discrimination. The task was administered during a training session after an 8 h baseline sleep episode, during test 1 after a 4 h EX sleep episode, and during test 2 after an 8 h recovery sleep episode. Slow-wave activity was suppressed during EX sleep. Each session consisted of 1250 trials and lasted ∼90 min. Values represent means + SEM. Attention did not differ between groups or sessions, and there was no interaction between these factors (two-way repeated-measures ANOVA) (see Results).
Figure 4.
Figure 4.
Relationship between EEG power density in NREM sleep and learning of a visual discrimination skill. Learning was quantified as percentage decrease in threshold SOA between a training session (100%) and a test session completed 24 h later (Fig. 2). A, Linear regression between SWA (power density in the 0.75–4.5 Hz range) in NREM sleep after training and magnitude of learning. SWA is from O2/P4 derivation. SWA(−) denotes group in which SWA was suppressed with sounds. No sounds were presented in control group. Data are from a 4 h experimental sleep episode and are expressed as a percentage of SWA in first 4 h of corresponding baseline sleep. Correlations with learning were similar for SWA from left occipitoparietal derivation (O1/P3, r = 0.82, p = 0.0002) and lower for left frontocentral (F3/C3, r = 0.64, p = 0.010) and right frontocentral (F4/C4, r = 0.62, p = 0.013) derivation (data not shown). Note that the effectiveness of acoustic suppression of SWA varied considerably across individuals, and in two subjects SWA remained close to baseline levels. B, Pearson correlations between EEG power density (O2/P4) in 0.5 Hz bins and learning (filled triangles, p < 0.05). Because of high-frequency noise in EEG at P4, power densities >15 Hz from one subject in control group were excluded from correlation analysis.

References

    1. Achermann P, Finelli LA, Borbely AA. Unihemispheric enhancement of delta power in human frontal sleep EEG by prolonged wakefulness. Brain Res. 2001;913:220–223. - PubMed
    1. Aeschbach D, Borbély AA. All-night dynamics of the human sleep EEG. J Sleep Res. 1993;2:70–81. - PubMed
    1. Aeschbach D, Cajochen C, Landolt H-P, Borbély AA. Homeostatic sleep regulation in habitual short sleepers and long sleepers. Am J Physiol. 1996;270:R41–R53. - PubMed
    1. Blake H, Gerard RW. Brain potentials during sleep. Am J Physiol. 1937;119:692–703.
    1. Borbély AA. A two process model of sleep regulation. Hum Neurobiol. 1982;1:195–204. - PubMed

Publication types

LinkOut - more resources