Comparative Study
. 2008 Mar 12;28(11):2864-73.
doi: 10.1523/JNEUROSCI.4063-07.2008.

Learning-related plasticity of temporal coding in simultaneously recorded amygdala-cortical ensembles

Affiliations
Comparative Study

Learning-related plasticity of temporal coding in simultaneously recorded amygdala-cortical ensembles

Stephen E Grossman et al. J Neurosci. .

Abstract

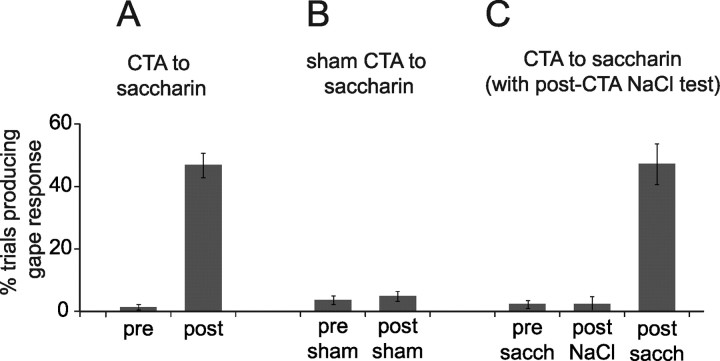
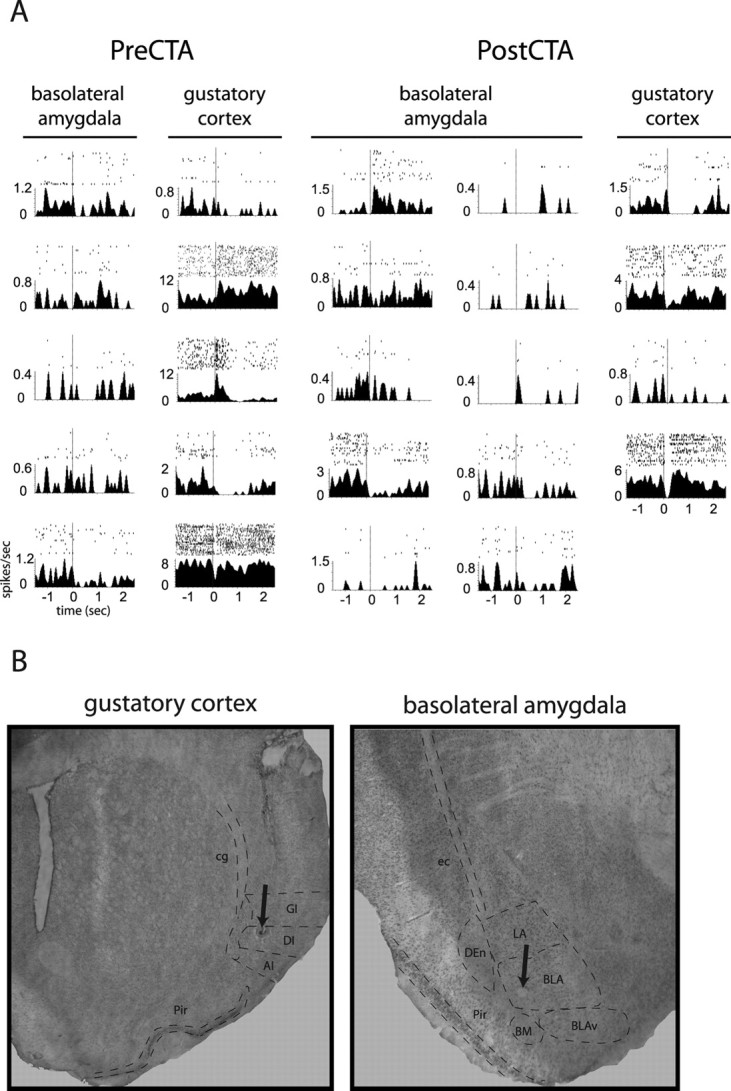
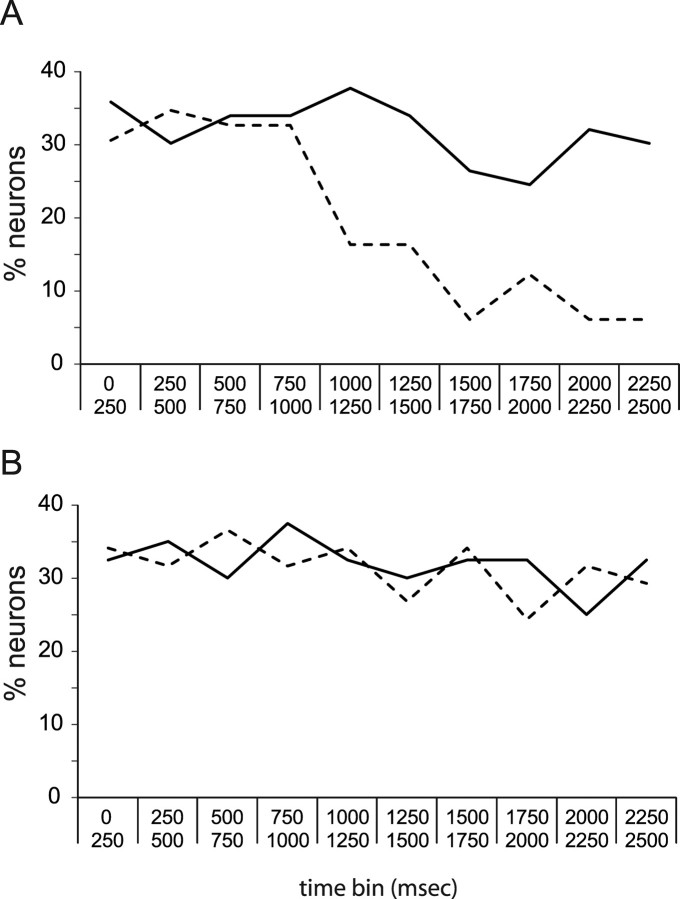
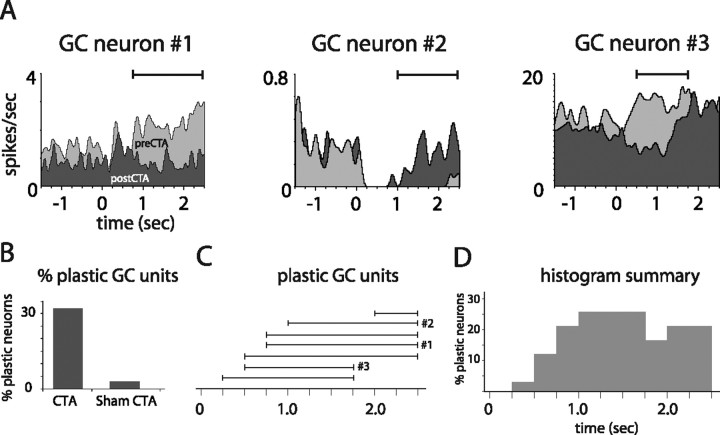
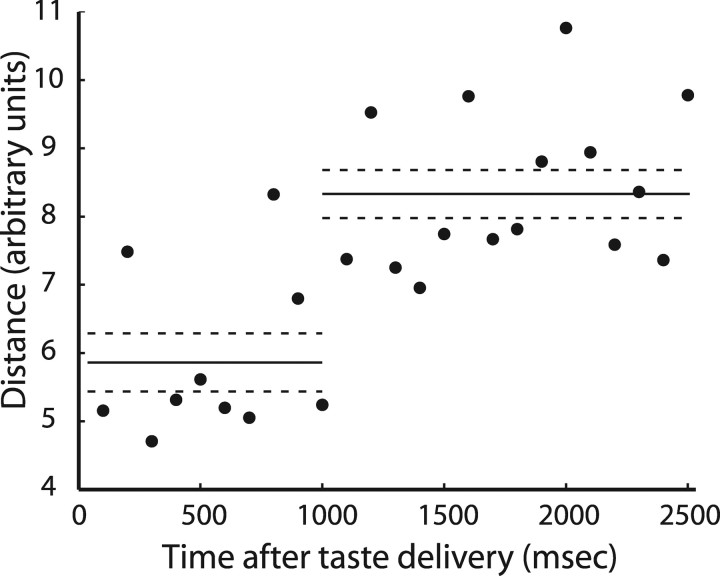
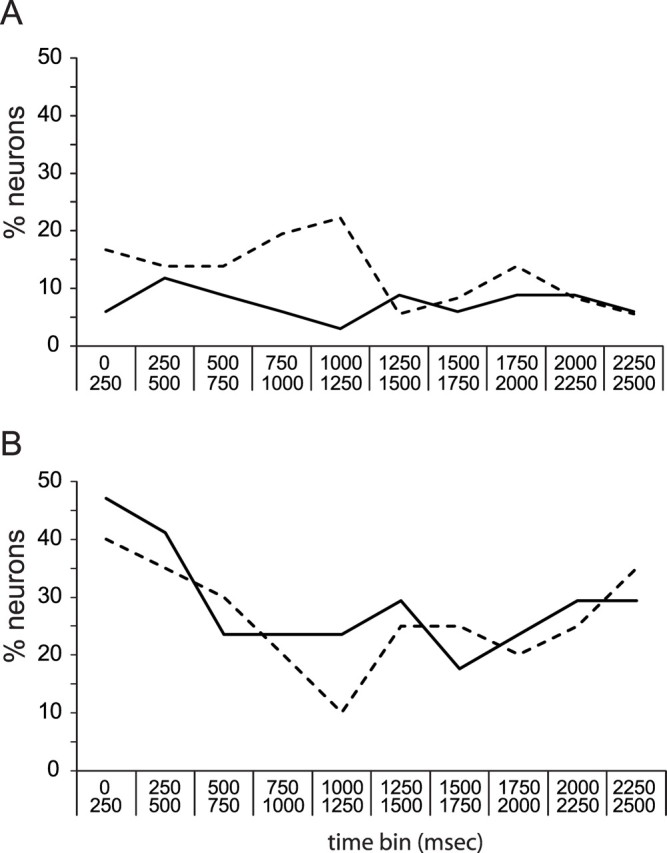
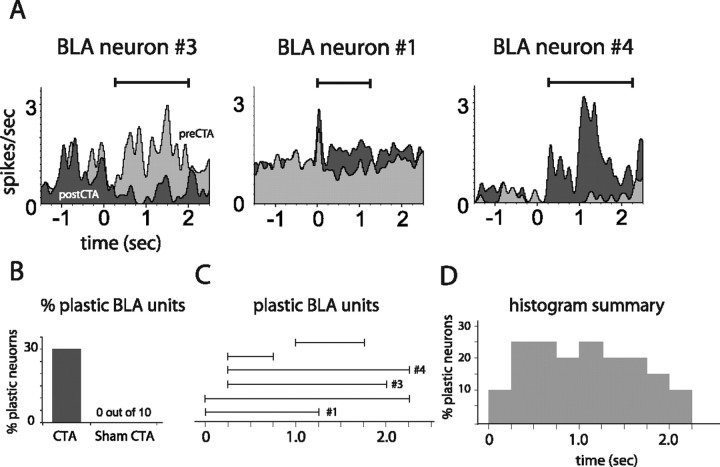
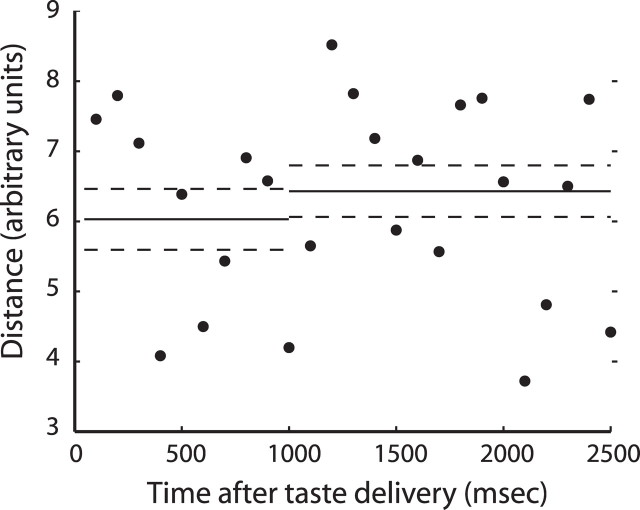
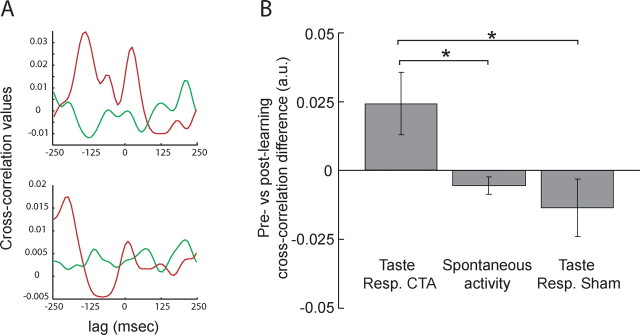
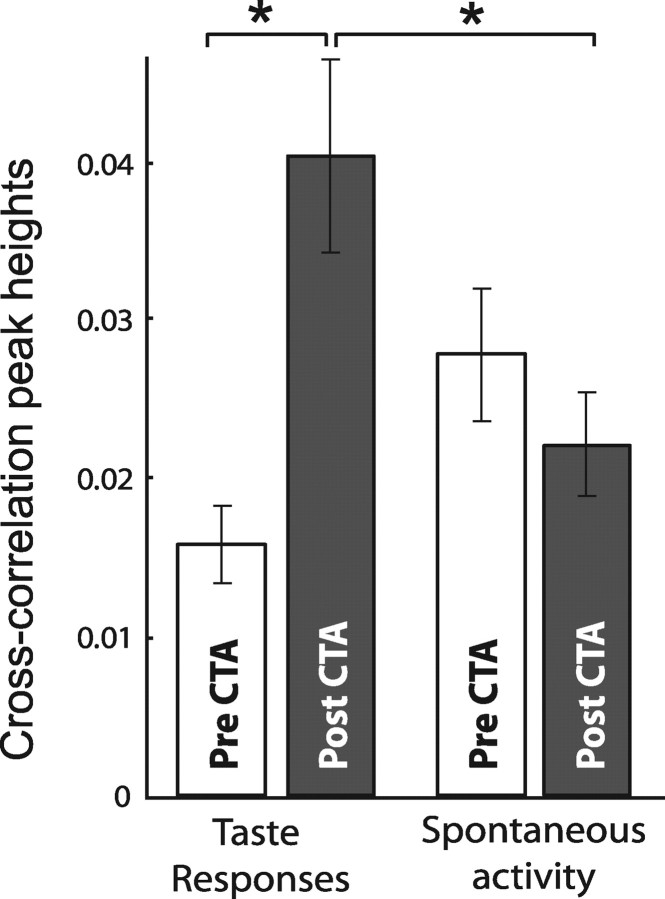
Emotional learning requires the coordinated action of neural populations in limbic and cortical networks. Here, we performed simultaneous extracellular recordings from gustatory cortical (GC) and basolateral amygdalar (BLA) neural ensembles as awake, behaving rats learned to dislike the taste of saccharin [via conditioned taste aversion (CTA)]. Learning-related changes in single-neuron sensory responses were observed in both regions, but the nature of the changes was region specific. In GC, most changes were restricted to relatively late aspects of the response (starting approximately 1.0 s after stimulus administration), supporting our hypothesis that in this paradigm palatability-related information resides exclusively in later cortical responses. In contrast, and consistent with data suggesting the amygdala's primary role in judging stimulus palatability, CTA altered all components of BLA taste responses, including the earliest. Finally, learning caused dramatic increases in the functional connectivity (measured in terms of cross-correlation peak heights) between pairs of simultaneously recorded BLA and GC neurons, increases that were evident only during taste processing. Our simultaneous assays of the activity of single neurons in multiple relevant brain regions across learning suggest that the transmission of taste information through amygdala-cortical circuits plays a vital role in CTA memory formation.


Figures

Figure 1.
Figure 1.
Associative learning. A, Naive rats (“pre-”) seldom gape in response to saccharin delivery (y-axis shows the percentage of deliveries that caused gapes), but trained rats (“post-”) do. B, Sham training, in which the nonemetic saline replaces the emetic LiCl, does not cause increased likelihood of gapes. C, CTAs to saccharin do not generalize to other palatable stimuli (in this case, NaCl), but even after testing with NaCl, saccharin continues to cause gapes.
Figure 2.
Figure 2.
Neural data. A, A representative pair of ensembles containing simultaneously recorded gustatory cortical and basolateral amygdalar neurons, recorded before and after a CTA was established to saccharin. For each neuron, the PSTH shows the average firing rate (y-axis) from −1.5 to 2.5 s after saccharin delivery (delivered via intraoral cannula at t = 0; vertical dashed lines). Above each PSTH, raster plots display individual action potentials as single black dots. Rasters are divided into 35 rows beginning with trial 1 on top and extending downward chronologically. B, Sample histology, showing placement of electrode tips (lesion holes are marked with arrows). Left, Electrode placement within the granular and dysgranular insular cortex. Right, Electrode placement within the basolateral amygdala. AI, Agranular insular cortex; BLAv, ventral basolateral amygdala; BM, basomedial amygdala; cg, cingulum; DEn, dorsal endopiriform cortex; DI, dysgranular insular cortex; ec, external capsule; GI, granular insular cortex; LA, lateral amygdala; Pir, piriform cortex.
Figure 3.
Figure 3.
The likelihood of GC saccharin responses in training and testing sessions, examined independently. A, The x-axis shows time (in 250 ms bins), and the y-axis shows the percentage of GC neurons showing significant responses to saccharin in ensembles recorded during training sessions (solid line) and ensembles recorded during testing sessions (dashed line). Similar percentages of neurons responded at all time points in the training ensembles, but in testing session ensembles there was a striking decrease in the percentage of saccharin responses starting at ∼1 s. B, Similarly divided data for neurons collected from control rats, showing that the changes in number of saccharin responses shown in A are a specific function of taste learning.
Figure 4.
Figure 4.
CTA-related plasticity in single GC neurons held across learning. A, PSTHs of three representative GC units recorded from CTA rats, each held through training and testing sessions. Each example contains overlain saccharin PSTHs from before (light gray) and after (dark gray) learning. Solid horizontal lines above the PSTHs delineate periods of significant learning-related changes. B, The overall percentage of GC neurons for which saccharin responses changed, for rats that received CTAs and control rats. C, The time bins during which CTA changed saccharin responses (i.e., as for the solid horizontal lines in A), for each plastic GC neuron. The x-axis shows poststimulus time in 250 ms bins. The results for the neurons shown in A are marked. D, A summary of these data, showing the total percentage of held GC units with modified firing at each time point.
Figure 5.
Figure 5.
CTA-related changes in GC population coding of taste for neurons held across learning. The y-axis shows the Euclidean distance between matching time points in the PCA analysis computed on the unsmoothed, unreduced data for successive 100 ms bins (x-axis); that is, these data show the difference between the prelearning and postlearning GC population codes for saccharin, at every point in stimulus-processing time. The solid horizontal lines represent the average distances computed for first poststimulus second and later time bins, respectively; the dashed lines are SE.
Figure 6.
Figure 6.
The likelihood of BLA saccharin responses in training and testing sessions, examined separately. A, The x-axis shows time (in 250 ms bins), and the y-axis shows the percentage of BLA neurons showing significant responses to saccharin in ensembles recorded during training sessions (solid line) and ensembles recorded during testing sessions (dashed line) in CTA rats. No significant differences in the number of BLA neurons that responded to saccharin were visible. B, Similar analysis for control rats.
Figure 7.
Figure 7.
CTA-related plasticity in single BLA neurons held across learning. A, PSTHs of three representative BLA units held through training and testing sessions. Each example contains overlain saccharin PSTHs from before (light gray) and after (dark gray) learning. Solid horizontal lines above the PSTHs delineate periods of significant learning-related changes. B, The overall percentage of BLA neurons for which saccharin responses changed, for rats that received CTAs and for control rats. C, The time bins during which CTA changed saccharin responses (i.e., as for the solid horizontal lines in A), for each plastic BLA neuron. The x-axis shows poststimulus time in 250 ms bins. The results for the neurons shown in A are marked. D, A summary of these data, showing the total percentage of held BLA units with modified firing at each time point.
Figure 8.
Figure 8.
CTA-related changes in BLA population coding of taste for neurons held across learning. Euclidean distances between matching time points in the PCA analysis, computed on the unsmoothed, unreduced data. The y-axis shows the Euclidean distance between matching time points in the PCA analysis computed on the unsmoothed, unreduced data for successive 100 ms bins (x-axis); that is, these data show the difference between the prelearning and postlearning BLA population codes for saccharin, at every point in stimulus-processing time. Conventions are as for Figure 5.
Figure 9.
Figure 9.
CTA enhances functional connectivity between BLA and GC. A, Prelearning (green) and postlearning (red) cross-correlations (y-axis, correlation value; x-axis, lag) for two representative GC–BLA neuron pairs. For each pair, the prelearning cross-correlation is relatively flat, and the postlearning cross-correlation peaks are much higher. B, Average differences in prelearning and postlearning cross-correlation peaks (y-axis) changed during taste sampling, but not during spontaneous activity, and not for rats receiving “sham” training. Error bars represent SEM. *p < 0.05.
Figure 10.
Figure 10.
Raw cross-correlation values show the magnitude of learning-induced increases in functional connectivity. The y-axis shows cross-correlation peak heights. Measured while rats were sampling saccharin, cross-correlations for GC and BLA neuron pairs more than doubled after CTA. No such learning-related difference was found in the same neuron pairs' spontaneous spiking. *p < 0.05 in paired t test.

References

    1. Armony JL, Quirk GJ, LeDoux JE. Differential effects of amygdala lesions on early and late plastic components of auditory cortex spike trains during fear conditioning. J Neurosci. 1998;18:2592–2601. - PMC - PubMed
    1. Bauer EP, Paz R, Pare D. Gamma oscillations coordinate amygdalo-rhinal interactions during learning. J Neurosci. 2007;27:9369–9379. - PMC - PubMed
    1. Berman DE, Dudai Y. Memory extinction, learning anew, and learning the new: dissociations in the molecular machinery of learning in cortex. Science. 2001;291:2417–2419. - PubMed
    1. Bermudez-Rattoni F, Grijalva CV, Kiefer SW, Garcia J. Flavor-illness aversions: the role of the amygdala in the acquisition of taste-potentiated odor aversions. Physiol Behav. 1986;38:503–508. - PubMed
    1. Berridge KC. Measuring hedonic impact in animals and infants: microstructure of affective taste reactivity patterns. Neurosci Biobehav Rev. 2000;24:173–198. - PubMed

Publication types

LinkOut - more resources