. 2008 Jun;19(6):1139-57.
doi: 10.1681/ASN.2007050596. Epub 2008 Mar 12.

Ectopic notch activation in developing podocytes causes glomerulosclerosis

Affiliations

Ectopic notch activation in developing podocytes causes glomerulosclerosis

Aoife M Waters et al. J Am Soc Nephrol. 2008 Jun.

Abstract

Genetic evidence supports an early role for Notch signaling in the fate of podocytes during glomerular development. Decreased expression of Notch transcriptional targets in developing podocytes after the determination of cell fate suggests that constitutive Notch signaling may oppose podocyte differentiation. This study determined the effects of constitutive Notch signaling on podocyte differentiation by ectopically expressing Notch's intracellular domain (NOTCH-IC), the biologically active, intracellular product of proteolytic cleavage of the Notch receptor, in developing podocytes of transgenic mice. Histologic and molecular analyses revealed normal glomerular morphology and expression of podocyte markers in newborn NOTCH-IC-expressing mice; however, mice developed severe proteinuria and showed evidence of progressive glomerulosclerosis at 2 wk after birth. Features of mature podocytes were lost: Foot processes were effaced; expression of Wt1, Nphs1, and Nphs2 was downregulated; cell-cycle re-entry was induced; and the expression of Pax2 was increased. In contrast, mice with podocyte-specific inactivation of Rbpsuh, which encodes a protein essential for canonical Notch signaling, seemed normal. In addition, the damaging effects of NOTCH-IC expression were prevented in transgenic mice after simultaneous conditional inactivation of Rbpsuh in murine podocytes. These results suggest that Notch signaling is dispensable during terminal differentiation of podocytes but that constitutive (or inappropriate) Notch signaling is deleterious, leading to glomerulosclerosis.


Figures
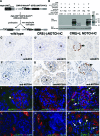
Figure 1.
Figure 1.
Podocyte-specific expression of MYCNOTCH-IC in newborn Neph-CRE/+;IC-Notch1/+ transgenic mouse kidneys. (A) Breeding scheme to generate transgenic mice that express MYCNOTCH-IC in podocytes. Neph-CRE/+ mice express CRE in podocytes under control of Nphs1 promoter elements. The modular IC-Notch1 transgene is represented pictorially. pCAGGS, CMV enhancer/chicken β-actin hybrid promoter; ▸, loxP; β-geo, β-galactosidase/neomycin/polyA fusion cassette; MYC, 6X human MYC epitope tag; IRES, internal ribosomal entry site; hPLAP, human placental alkaline phosphatase. (B) Analysis of MYCNOTCH-IC protein expression in lysates of isolated glomeruli as separated by SDS-PAGE. Top and bottom left panels show Western blot results after incubation with anti-MYC and anti–β-actin antibodies, respectively. Black arrowhead in top panel denotes band position corresponding to MYCNOTCH-IC with approximate molecular weight of 111 kD. Black arrowhead in lower panel denotes actin band. Top right panel shows protein ladder (MW Std.) and corresponding protein molecular weights. (C through H) Detection of conditional MYCNOTCH-IC protein in podocytes as revealed by immunohistochemistry using anti-MYC (C through E), and anti-NOTCH1 (F through H) antibodies. Nonserial, representative images are shown of newborn mouse kidney tissue sections from wild-type (C and F), CRE(−);NOTCH-IC(D and G), and CRE(+);NOTCH-IC (E and H) mice. Black arrows denote anti-MYC or anti-NOTCH -stained cells. g, glomeruli. Sections were counterstained with hematoxylin. (I through N) Dual immunofluorescence labeling of mouse kidney tissue sections with either anti-MYC (green) and anti-CD31 (red) antibodies (I through K) or anti-MYC (green) and LTL (red; L through N). Shown are representative images of glomeruli from wild type (I and L), CRE(−);NOTCH-IC (J and M), and CRE(+);NOTCH-IC (K and N) mice. For L through N, anti-MYC staining was originally detected with AlexaFluor 594 secondary antibody, and LTL staining was performed with FITC-LTL. For comparative purposes, corresponding original images (shown in Supplemental Figure 1) were color-adjusted using Photoshop 6.0 to show anti-MYC immunodetection as green and LTL reactivity as red. Sections were counterstained with DAPI. White arrows, anti-MYC–labeled podocytes. White arrowheads, background anti-MYC/anti-mouse IgG immunoreactivity. Magnifications: ×400 in C through H; ×1000 in I through N.
Figure 2.
Figure 2.
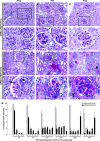
Histologic progression of glomerular lesions in CRE(+);NOTCH-IC transgenic mice. (A through L) Representative images of PAS-stained tissue sections from P14 (A, D, G, and J), P21 (B, E, H, and K), and P42 (C, F, I, and L) mouse kidneys. (A through F) CRE(−);NOTCH-IC mice; (G through L) CRE(+);NOTCH-IC mice. (D through F and J through L) Corresponding boxed areas. (J) Black arrows show zones of mesangial hypercellularity and matrix increase, with decreased caliber of neighboring capillaries at P14. (K) At P21, glomerulus shows further increase in PAS-stained mesangial matrix and reduced caliber of glomerular capillaries. (L) At P42, glomerulus shows intense PAS-stained mesangial matrix expansion, obliteration of glomerular capillaries, and thickening of parietal epithelium (black arrowhead). (M) Frequency distribution plot showing percentage of total number of glomeruli per tissue section at P0, P7, P14, P21, P28, and P42 (n = 3 mice per age group) with corresponding GS score. ▒, CRE(−);NOTCH-IC mice; ▪, CRE(+);NOTCH-IC mice. SE as shown. Magnifications: ×400 in A through C and G through I; ×800 in D through F and J through L.
Figure 3.
Figure 3.
Transmission electron micrographs (TEM) of CRE(+);NOTCH-IC mouse glomeruli. (A) P42 CRE(−);NOTCH-IC mouse glomerulus. cap., patent capillary lumina. (B) P42 CRE(+);NOTCH-IC mouse glomerulus. cap., decreased capillary lumen diameter. White * denotes mesangial matrix expansion. (C) Podocyte-endothelial interface of a CRE(−);NOTCH-IC glomerular capillary loop. fp, normal foot processes. White arrow, normal glomerular basement membrane. (D) Corresponding interface from a CRE(+);NOTCH-IC glomerulus. Single black arrow, focal foot process effacement; double black arrows, normal-appearing foot processes; white arrow, glomerular basement membrane neither thickened nor split. Magnifications: ×2200 in A and B; ×13,000 in C and D.
Figure 4.
Figure 4.
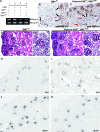
Glomerular Wt1, Nphs1, and Nphs2 mRNA expression in CRE(+);NOTCH-IC mice. (A and B) Semiquantitative RT-PCR on total RNA extracted from isolated glomeruli of CRE(−);NOTCH-IC and CRE(+);NOTCH-IC mice. (A) Shown are RT-PCR results from P7 (top), P14 (middle), and P21 (bottom) mice after agarose gel electrophoresis. Gene name and corresponding band size are indicated in the left margin. (B) Graphic representation of RT-PCR results by gene name and postnatal age showing mRNA expression as determined by band densitometry. Shown are mean mRNA expression levels calculated as the number of pixels per band for a corresponding gene divided by number of pixels per band for loading control mRNA (18S). ▒, CRE(−);NOTCH-IC; ▪, CRE(+);NOTCH-IC. Error bars denote SE. * P < 0.05. (C through H) Representative, nonserial images of frozen sections from P14 CRE(−);NOTCH-IC (C, E, and G) and CRE(+);NOTCH-IC (D, F, and H) kidneys showing mRNA in situ hybridization using specific nonradioactive riboprobes. (C and D) Wt1. (E and F) Nphs1. (G and H) Nphs2. Corresponding insets are magnified views of regions enclosed by black boxes. Sections are counterstained with Nuclear Fast Red. (D, F, and H) Black arrows, representative glomeruli showing decreased Wt1, Nphs1, and Nphs2 mRNA expression. (D, F, and H insets) Magnified image of representative CRE(+);NOTCH-IC glomeruli showing global decreased Wt1 mRNA expression (D, inset) or segmental decreased Nphs1 mRNA expression (F, inset, black arrow) and Nphs2 mRNA expression (H, inset). (F and H insets) White arrows, some cells within the same glomerulus maintain Nphs1 and Nphs2 expression. Magnification, ×200 in C through H.
Figure 5.
Figure 5.
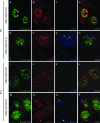
Decreased NEPHRIN protein expression in MYCNOTCH-IC–expressing podocytes. (A through P) Shown are representative micrographs of glomeruli after triple immunofluorescence labeling of mouse tissue sections with anti-NEPHRIN, anti-WT1, and anti-MYC antibodies. (A through C and I through K) Serial micrographs of P0 (A through C) and P14 (I through K) CRE(−);NOTCH-IC glomeruli after multichannel imaging. (E through G and M through O) Serial micrographs of P0 (E through G) and P14 (M through O) CRE(+);NOTCH-IC obtained by multichannel imaging. (A, E, I, and M) Green channel images showing anti-NEPHRIN immunodetection with Alexa488-conjugated secondary antibody. (B, F, J, and N) Red channel images showing anti-WT1 immunodetection with Alexa594-conjugated secondary antibody. (C, G, K, and O) Blue channel images showing anti-MYC immunodetection with Cy5-conjugated secondary antibody. (D, H, L, and P) Merged images of corresponding micrographs obtained from green, red, and blue channels. (F and N) Red arrowheads, podocytes stained positively with anti-WT1 antibody. (G and O) Blue arrowheads, cells stained positively with anti-MYC antibody. (H and P) Pink arrowheads, cells that show overlapping staining for both anti-WT1 and anti-MYC antibodies [i.e., (anti-WT1, anti-MYC)–double-positive cells] identifying these cells as MYCNOTCH-IC–expressing podocytes. (H, green arrows) Preservation of anti-NEPHRIN staining in vicinity of (anti-WT1, anti-MYC)–double-positive cells at P0. (P, green arrow) Loss of anti-NEPHRIN staining in vicinity of (anti-WT1, anti-MYC)–double-positive cells at P14. Magnification, ×1000.
Figure 6.
Figure 6.
Analysis of glomerular cell proliferation in CRE;NOTCH-IC transgenic mice. (A through P) Shown are representative micrographs of glomeruli after triple immunofluorescence labeling of mouse tissue sections with anti-WT1, anti-MYC, and anti-Ki67 antibodies. (A through C and I through K) Serial micrographs of P7 (A through C) and P21 (I through K) CRE(−);NOTCH-IC glomeruli after multichannel imaging. (E through G and M through O) Serial micrographs of P7 (E through G) and P21 (M through O) CRE(+);NOTCH-IC obtained by multichannel imaging. (A, E, I, and M) Red channel images showing anti-WT1 immunodetection with Alexa594-conjugated secondary antibody. (B, F, J, and N) Green channel images showing anti-MYC immunodetection with Alexa488-conjugated secondary antibody. (C, G, K, and O) Blue channel images showing anti-Ki67 immunodetection with Cy5-conjugated secondary antibody. (D, H, L, and P) Merged images of corresponding micrographs obtained through green, red, and blue channels. Sections were counterstained with DAPI. DAPI images were converted to grayscale and merged onto corresponding green, red, and blue channel images. (E and M) Red arrows, podocytes stained positively with anti-WT1 antibody. (F and N) Green arrows, cells stained positively with anti-MYC antibody. (C, G, K, and O) Blue arrows and arrowheads, cells stained positively with anti-Ki67 antibody. (D, H, L, and P) White arrows, cells showing overlapping staining with anti-WT1, anti-MYC, and anti-Ki67 antibodies (anti-WT1, anti-MYC, anti-Ki67)–triple-positive cells), identifying these cells as proliferating, MYCNOTCH-IC–transformed podocytes. (H, red arrows) Nonproliferating podocytes as revealed by positive staining with anti-WT1 but absent anti-MYC or anti-Ki67 immunoreactivity. (D, H, and L, blue arrowheads) Ki67-positive cells that lack anti-WT1 or anti-MYC immunoreactivity. Magnification, ×1000.
Figure 7.
Figure 7.
Analysis of Pax2 expression in podocytes of CRE(+);NOTCH-IC transgenic mice. (A through H) Pax2 mRNA in situ hybridization in frozen sections of transgenic mouse kidneys. Shown are representative images from P7 (A, B, E, and F) and P28 (C, D, G, and H) mouse kidneys. (A through D) Low-power images of CRE(−);NOTCH-IC (A and C) and CRE(+);NOTCH-IC (B and D) mouse kidney cryosections. (E through H) Magnified views of CRE(−);NOTCH-IC (E and G) and CRE(+);NOTCH-IC (F and H) glomeruli enclosed by black boxes in corresponding top panels. At P7, Pax2 mRNA transcripts are not detected in glomeruli of CRE(−);NOTCH-IC (A and E) or CRE(+);NOTCH-IC (B and F) mouse kidneys. In contrast, at P28, Pax2 mRNA transcripts are detected in podocytes of CRE(+);NOTCH-IC glomeruli (H, black arrows). Also, Pax2 mRNA is detected in parietal glomerular epithelium (H, black arrowhead). (I through N) Dual immunofluorescence labeling of mouse kidney tissue sections with anti-MYC and anti-PAX2 antibodies. Shown are representative serial micrographs of glomeruli obtained from P28 CRE(−);NOTCH-IC (I through K) and CRE(+);NOTCH-IC (L through N) mouse kidneys imaged by multichannel fluorescence microscopy. (I and L) Green channel images showing anti-MYC immunodetection with Alexa488-conjugated secondary antibody. Green arrows, cells stained positively with anti-MYC antibody. (J and M) Red channel images showing anti-PAX2 immunodetection with Alexa594-conjugated secondary antibody. Red arrows and arrowheads, cells stained positively with anti-PAX2. Sections were counterstained with DAPI, imaged by blue channel, and merged onto corresponding green and red channel images. (K and N) Merged images of corresponding green, red, and blue channel images. (N, yellow arrows) Cells showing overlapping staining with anti-MYC and anti-PAX2 antibodies, identifying these cells as coexpressing MYCNOTCH-IC and PAX2. (K and N, red arrowheads) PAX2-positive cells that do not stain positively with anti-MYC antibody. Magnifications: ×200 in A through D; ×1000 in E through N.
Figure 8.
Figure 8.
Phenotypic analysis of podocyte-specific Rbpsuh conditional knockout mice. (A) Semiquantitative, multiplex RT-PCR analysis of Rbpsuh mRNA expression in newborn mouse kidney after podocyte-specific mutational inactivation of Rbpsuh. Total kidney cortex Rbpsuh mRNA was evaluated by comparing the relative intensities of PCR products corresponding to Rbpsuh (top bands) and Gapdh (bottom bands) within each lane. Results shown are representative multiplex RT-PCR for the following genotypes: CRE-negative, RBPf/+ (lane 1), Podocin-CRE/+;RBPf/+ (lane 2), and Podocin-CRE/+;RBPf/del (lanes 3 and 4) mice. (B and C) Representative images of anti–RBPJ-κ antibody staining patterns in tissue sections from CRE-negative RBPf/+ (B) and Podocin-CRE/+;RBPf/del (C) newborn mouse kidneys. Glomerular structures are identified at three representative stages of development: S-shaped bodies (S); capillary loop stage glomeruli (cap.), and more advanced stage (g). Brown-stained nuclei, cells staining positively with anti–RBPJ-κ antibody; black arrows, anti–RBPJ-κ antibody-positive podocytes; red arrows, anti–RBPJ-κ antibody-negative podocytes. (H through M) mRNA in situ hybridization using probes for podocyte-specific markers Wt1 (H and I) and Nphs1 (J and K). Representative images are shown of kidney frozen sections from P21 control (H and J) and CRE-positive;RBPf/del (J and K) mice. Magnification, ×200 in B through G; ×100 in H through K.
Figure 9.
Figure 9.
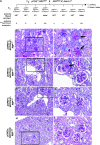
Phenotypic rescue of glomerulosclerosis in CRE(+);NOTCH-IC transgenic mice with simultaneous podocyte-specific mutational inactivation of Rbpsuh. (A) Schematic representation of breeding to generate Podocin-CRE/+;RBPf/del;IC-Notch1/+ transgenic mice and associated littermates. Shown are F0 generation and a subset of F1 that harbor the IC-NOTCH1 transgenic allele. Resulting effect of podocyte-specific, CRE-mediated recombination on conditional Rbpsuh allele (RBPf) and MYCNOTCH-IC expression is represented in lanes below corresponding genotypes. pCRE, Podocin-CRE; RBP+, wild type Rbpsuh allele; RBPdel, mutated conditional Rbpsuh allele previously generated by ubiquitous CRE-mediated recombination (see the Concise Methods section). WT, no mutated Rbpsuh alleles; HET, one mutated Rbpsuh allele; KO, two mutated Rbpsuh alleles; +, MYCNOTCH-IC present; −, MYCNOTCH-IC absent. (B, D, F, and H) Representative low-power images of PAS-stained kidney tissue sections from Podocin-CRE/+;IC-Notch1/+;RBP+/+ [pCRE(+);NOTCH-IC;RBPWT; B], Podocin-CRE/+;IC-Notch1/+; RBPf/+ [pCRE(+);NOTCH-IC;RBPHET; D], Podocin-CRE/+;IC-Notch1/+; RBPf/del [pCRE(+);NOTCH-IC;RBPKO; F], and IC-Notch1/+;RBPf/+ (H). (C, E, G, and I) High-power views of marked regions (black box) in corresponding left-hand images. Black arrows, glomeruli with evidence of glomerulosclerosis; blue arrowhead, dilated tubule filled with PAS-positive material. Magnifications: ×400 in B, D, F, and H; ×800 in C, E, G, and I.

Comment in

Similar articles

Cited by

References

    1. Wang P, Pereira FA, Beasley D, Zheng H: Presenilins are required for the formation of comma- and S-shaped bodies during nephrogenesis. Development 130: 5019–5029, 2003 - PubMed
    1. Cheng HT, Miner JH, Lin M, Tansey MG, Roth K, Kopan R: Gamma-secretase activity is dispensable for mesenchyme-to-epithelium transition but required for podocyte and proximal tubule formation in developing mouse kidney. Development 130: 5031–5042, 2003 - PubMed
    1. Cheng HT, Kim M, Valerius MT, Surendran K, Schuster-Gossler K, Gossler A, McMahon AP, Kopan R: Notch2, but not Notch1, is required for proximal fate acquisition in the mammalian nephron. Development 135: 801–811, 2007 - PMC - PubMed
    1. Kadesch T: Notch signaling: The demise of elegant simplicity. Curr Opin Genet Dev 14: 506–512, 2004 - PubMed
    1. Schroeter EH, Kisslinger JA, Kopan R: Notch-1 signaling requires ligand-induced proteolytic release of intracellular domain. Nature 393: 382–386, 1998 - PubMed

Publication types

Substances

LinkOut - more resources