. 2008 Mar 18;105(11):4209-14.
doi: 10.1073/pnas.0709765105. Epub 2008 Mar 12.

Rapid chemotactic response enables marine bacteria to exploit ephemeral microscale nutrient patches

Affiliations

Rapid chemotactic response enables marine bacteria to exploit ephemeral microscale nutrient patches

Roman Stocker et al. Proc Natl Acad Sci U S A. .

Abstract

Because ocean water is typically resource-poor, bacteria may gain significant growth advantages if they can exploit the ephemeral nutrient patches originating from numerous, small sources. Although this interaction has been proposed to enhance biogeochemical transformation rates in the ocean, it remains questionable whether bacteria are able to efficiently use patches before physical mechanisms dissipate them. Here we show that the rapid chemotactic response of the marine bacterium Pseudoalteromonas haloplanktis substantially enhances its ability to exploit nutrient patches before they dissipate. We investigated two types of patches important in the ocean: nutrient pulses and nutrient plumes, generated for example from lysed algae and sinking organic particles, respectively. We used microfluidic devices to create patches with environmentally realistic dimensions and dynamics. The accumulation of P. haloplanktis in response to a nutrient pulse led to formation of bacterial hot spots within tens of seconds, resulting in a 10-fold higher nutrient exposure for the fastest 20% of the population compared with nonmotile cells. Moreover, the chemotactic response of P. haloplanktis was >10 times faster than the classic chemotaxis model Escherichia coli, leading to twice the nutrient exposure. We demonstrate that such rapid response allows P. haloplanktis to colonize nutrient plumes for realistic particle sinking speeds, with up to a 4-fold nutrient exposure compared with nonmotile cells. These results suggest that chemotactic swimming strategies of marine bacteria in patchy nutrient seascapes exert strong influence on carbon turnover rates by triggering the formation of microscale hot spots of bacterial productivity.


Conflict of interest statement

The authors declare no conflict of interest.

Figures

Fig. 1.
Fig. 1.
Microchannels used to probe the chemotactic response of bacteria to nutrient patches and plumes. (a) Microchannel for diffusing nutrient pulse experiments. The two inlets (“in”) are for bacteria (yellow) and chemoattractant (white). (b) Microinjector tip, corresponding to the red dashed box in a. The 300-μm-wide injected nutrient band was visualized by using 100 μM fluorescein. (c) Cylindrical particle (R = 250 μm) used in the nutrient plume experiments.
Fig. 2.
Fig. 2.
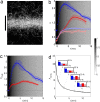
Response to a nutrient pulse. (a) Trajectories of P. haloplanktis, 2 min after release of a 300-μm-wide nutrient pulse (black bar). Each white path is an individual trajectory. (b) Time evolution of the hot spot index H for P. haloplanktis (blue, with chemoattractant; light blue, control run) and E. coli (red, with chemoattractant; light red, control run). Initially H < 1 because the nutrient band is devoid of bacteria. (c) Mean chemotactic advantage index ACHE over nonmotile cells. The gray background and associated color bar indicate the mean nutrient concentration within the central 300-μm region, normalized by its initial value. Color scheme as in b. (d) Chemotactic advantage ACHE,i of individual bacteria inside the central 300-μm region relative to those outside. (Insets) The fraction of the population inside the central band at four points in time (the color scheme is as in b).
Fig. 3.
Fig. 3.
Experimental and numerical bacterial response. (a) Chemotactic advantage ACHE from numerical simulations of chemotactic bacteria exposed to a 1D (open symbols) and a 3D (closed symbols) nutrient pulse, for three swimming speeds (circles, VB = 31 μm s−1; squares, VB = 68 μm s−1; and triangles, VB = 150 μm s−1). The 3D pulse was modeled as the lysis of a 30-μm radius algal cell. (b) The equivalent exposure time TC from a nutrient plume for P. haloplanktis and a nonmotile population, determined experimentally for three particle sinking speeds (circles, U = 66 μm s−1; squares, U = 220 μm s−1; triangles, U = 660 μm s−1). (c) Experimental ACHE of P. haloplanktis as a function of position y in the plume, for the same U as in b. (d) Numerical ACHE in the plume of a cylinder (2D) and a sphere (3D) as a function of swimming speed VB, for the same U as in b.
Fig. 4.
Fig. 4.
Response to a nutrient plume. (a) Accumulation of P. haloplanktis in the nutrient plume of a particle sinking at U = 110 μm s−1. Flow is from bottom to top, and each black dot represents one bacterium. Red indicates higher nutrient concentration. (b–d) Distribution of nutrients (b1, c1, and d1) and P. haloplanktis (b2, c2, and d2) normalized to a mean of 1, for three sinking speeds (U). The distribution of P. haloplanktis was found by binning positions of individual bacteria from a grid of 17 (in y) by 3 (in x) images. Control runs are shown in SI Appendix 1 Fig. 5.

References

    1. Azam F. Microbial control of oceanic carbon flux: The plot thickens. Science. 1998;280:694–696.
    1. Blackburn N, Fenchel T, Mitchell J. Microscale nutrient patches in planktonic habitats shown by chemotactic bacteria. Science. 1998;282:2254–2256. - PubMed
    1. Fenchel T. Microbial behavior in a heterogeneous world. Science. 2002;296:1068–1071. - PubMed
    1. Mitchell JG, Okubo A, Fuhrman JA. Microzones surrounding phytoplankton form the basis for a stratified marine microbial ecosystem. Nature. 1985;316:58–59.
    1. Blackburn N, Azam F, Hågström A. Spatially explicit simulations of a microbial food web. Limnol Oceanogr. 1997;42:613–622.

Publication types

LinkOut - more resources