

Mutational load distribution analysis yields metrics reflecting genetic instability during pancreatic carcinogenesis
- PMID: 18337498
- PMCID: PMC2393774
- DOI: 10.1073/pnas.0708250105
Mutational load distribution analysis yields metrics reflecting genetic instability during pancreatic carcinogenesis
Abstract
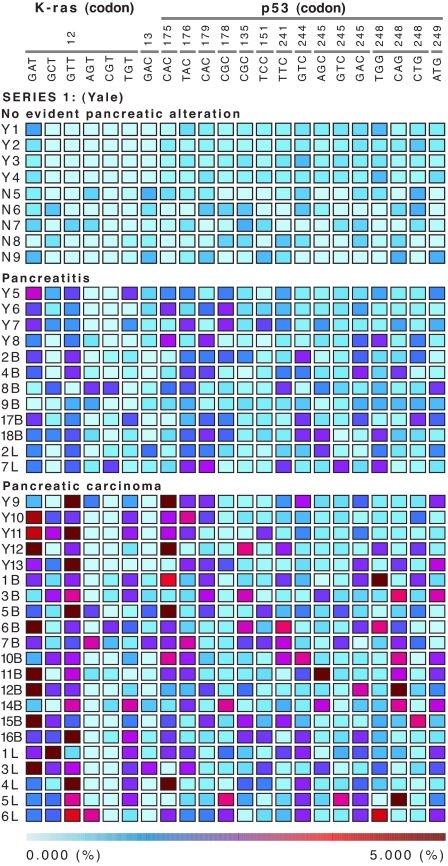
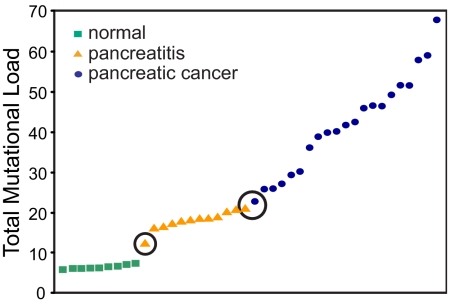
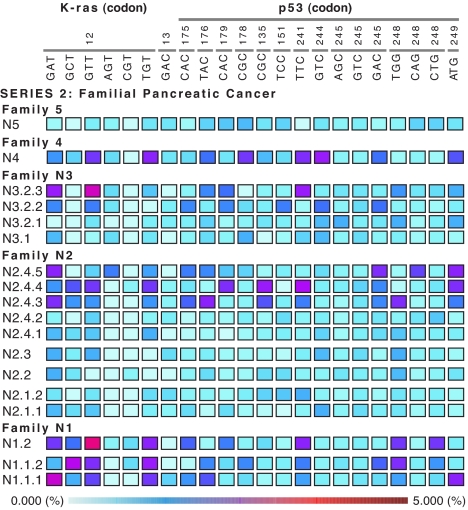
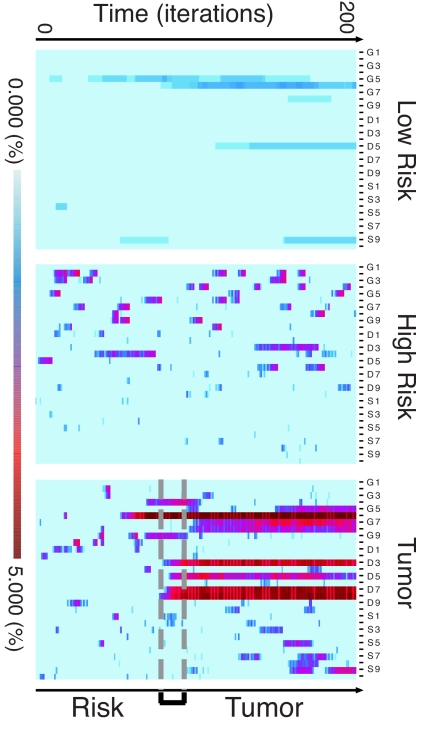
Considering carcinogenesis as a microevolutionary process, best described in the context of metapopulation dynamics, provides the basis for theoretical and empirical studies that indicate it is possible to estimate the relative contribution of genetic instability and selection to the process of tumor formation. We show that mutational load distribution analysis (MLDA) of DNA found in pancreatic fluids yields biometrics that reflect the interplay of instability, selection, accident, and gene function that determines the eventual emergence of a tumor. An in silico simulation of carcinogenesis indicates that MLDA may be a suitable tool for early detection of pancreatic cancer. We also present evidence indicating that, when performed serially in individuals harboring a p16 germ-line mutation bestowing a high risk for pancreatic cancer, MLDA may be an effective tool for the longitudinal assessment of risk and early detection of pancreatic cancer.
Conflict of interest statement
Conflict of interest statement: J.C. serves on the Board of Directors of Aureon Laboratories. Aureon Laboratories have exclusive license from Yale University to use MLDA as a potential diagnostic cancer test.
Figures
Similar articles
-
KRAS mutation and epithelial-macrophage interplay in pancreatic neoplastic transformation.Int J Cancer. 2018 Oct 15;143(8):1994-2007. doi: 10.1002/ijc.31592. Epub 2018 Aug 9. Int J Cancer. 2018. PMID: 29756386 Free PMC article.
-
[Mutations of the Ki-ras gene: an early event in pancreatic carcinogenesis].Z Gastroenterol. 1994 Jul;32(7):420-1. Z Gastroenterol. 1994. PMID: 7975782 German. No abstract available.
-
[Alterations of the p16 gene for the carcinogenesis in pancreas].Zhongguo Yi Xue Ke Xue Yuan Xue Bao. 2000 Oct;22(5):491-3. Zhongguo Yi Xue Ke Xue Yuan Xue Bao. 2000. PMID: 12903437 Review. Chinese.
-
Progression of Chronic Pancreatitis to Pancreatic Cancer: Is There a Role of Gene Mutations as a Screening Tool?Pancreas. 2018 Feb;47(2):227-232. doi: 10.1097/MPA.0000000000000975. Pancreas. 2018. PMID: 29303908
-
Role of hypermethylation on carcinogenesis in the pancreas.Surg Today. 2004;34(12):981-6. doi: 10.1007/s00595-004-2858-6. Surg Today. 2004. PMID: 15580378 Review.
Cited by
-
Systems pathology: a critical review.Mol Oncol. 2012 Feb;6(1):27-32. doi: 10.1016/j.molonc.2011.11.007. Epub 2011 Nov 27. Mol Oncol. 2012. PMID: 22178234 Free PMC article. Review.
-
Contribution of the Type II Chaperonin, TRiC/CCT, to Oncogenesis.Int J Mol Sci. 2015 Nov 6;16(11):26706-20. doi: 10.3390/ijms161125975. Int J Mol Sci. 2015. PMID: 26561808 Free PMC article. Review.
References
-
- Bhatia S, Yasui Y, Robison LL, Birch JM, Bogue MK, Diller L, DeLaat C, Fossati-Bellani F, Morgan E, Oberlin O, et al. J Clin Oncol. 2003;21:4386–4394. - PubMed
-
- Rouse JJ, Stephen P. Science. 2002;297:547–551. - PubMed
-
- Dolle MET, Giese H, Hopkins CL, Martus HJ, et al. Nat Genet. 1997;17:431–434. - PubMed
-
- King CM, Gillespie ES, McKenna PG, Barnett YA. Mutat Res. 1994;316:79–90. - PubMed
Publication types
MeSH terms
LinkOut - more resources
Full Text Sources
Medical
