. 2008 Mar 18;105(11):4226-31.
doi: 10.1073/pnas.0800630105. Epub 2008 Mar 12.

Insulin signaling is involved in the regulation of worker division of labor in honey bee colonies

Affiliations

Insulin signaling is involved in the regulation of worker division of labor in honey bee colonies

Seth A Ament et al. Proc Natl Acad Sci U S A. .

Abstract

It has been proposed that one route of behavioral evolution involves novel regulation of conserved genes. Age-related division of labor in honey bee colonies, a highly derived behavioral system, involves the performance of different feeding-related tasks by different groups of individuals. Older bees acquire the colony's food by foraging for nectar and pollen, and the younger "nurse" bees feed larvae processed foods. The transition from hive work to foraging has been shown to be socially regulated and associated both with decreases in abdominal lipid stores and with increases in brain expression of genes implicated in feeding behavior in Drosophila melanogaster. Here we show that division of labor is influenced by a canonical regulator of food intake and energy balance in solitary species, the insulin/insulin-like growth factor signaling (IIS) pathway. Foragers had higher levels of IIS gene expression in the brain and abdomen than did nurses, despite their low lipid stores. These differences are likely nutritionally mediated because manipulations that induced low lipid stores in young bees also up-regulated these genes. Changes in IIS also causally influenced the timing of behavioral maturation: inhibition of the insulin-related target of rapamycin pathway delayed the onset of foraging in a seasonally dependent manner. In addition, pathway analyses of microarray data revealed that nurses and foragers differ in brain energy metabolism gene expression, but the differences are opposite predictions based on their insulin-signaling status. These results suggest that changes in the regulation of the IIS pathway are associated with social behavior.


Conflict of interest statement

The authors declare no conflict of interest.

Figures
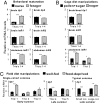
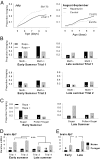
Fig. 1.
Fig. 1.
Up-regulation of insulin-signaling genes in the brain and abdomen of worker honey bees during behavioral maturation and in response to poor nutrition [quantitative PCR (qPCR)]. (A) IIS gene expression in brains and abdomens of nurses and foragers. Data were pooled from four independent trials. ANOVA; brain ilp1, Pgroup (df = 1,68) < 0.0001, Pgroup×trial(df = 3,68) < 0.0001; brain ilp2, Pgroup(df=1,67) < 0.05, Pgroup×trial(df=3,67) < 0.0001; brain inR1, Pgroup (df=1,67) > 0.05, Pgroup×trial(df=3,67) > 0.05; brain inR2, Pgroup(df=1,67) > 0.05, Pgroup×trial(df=3,67) > 0.05; abdominal inR1, Pgroup(df=1,71) < 0.0001, Pgroup×trial df=3,71) = 0.05; abdominal inR2, Pgroup(df=1,71) < 0.0001, Pgroup×trial(df=3,71) > 0.05. Results from individual trials are given in SI Fig. 5. (B) IIS gene expression in brains/heads and abdomens of 4- and 6-day-old bees caged and fed pollen and sugar or a sugar-only diet. Data for brain and head ilp1 were pooled from five independent trials (ANOVA: Pdiet(df=1,74) < 0.05, Ptrial×diet(df=4,74) > 0.05). Data for brain inR1 were pooled from four independent trials (Pdiet(df=1,62) < 0.05, Pdiet×trial(df=3,62) > 0.05). Two independent trials for abdomen inR1 are shown. Data from all individual trials are shown in SI Fig. 6. (C) ilp1 expression in brains/heads after field diet manipulations. Data are shown for brain ilp1 from three early-summer trials that used single-cohort colonies (ANOVA: Pdiet(df=1,45) < 0.0001, Ptrial(df=2,45) < 0.001, Pdiet×trial(df=2,45) < 0.05). Data are shown for head ilp1 from two individual late-summer trials that used single-cohort colonies (combined analysis: Pdiet(df=1,37) < 0.01, Ptrial(df=1,37) < 0.0001, Pdiet×trial(df=1,37) > 0.05). Single trials were performed for head ilp1 with small typical colonies and large typical colonies in late summer. Main effect of group or diet for pooled trials and Student's t tests for individual trials: *, P < 0.05; **, P < 0.01; ***, P < 0.001.
Fig. 2.
Fig. 2.
Delayed behavioral maturation caused by rapamycin. (A) Proportion of bees that initiated foraging at 5–9 days of age after rapamycin or control treatments. Data for early summer (July 2006) and late summer (August–September 2006) are pooled from five and four trials, respectively. Cox Proportional Hazards: all trials in 2006 (meth, methoprene; rapa, rapamycin; trt, treatment) (foragers/total), nrapa = 120/587, ncontrol = 109/547, Ptrt < 0.05, Pdateoftrial < 0.05, Ptrt×date < 0.01, Ptrial < 0.05, Ptrt×trial < 0.05; early summer 2006, nrapa = 47/217, ncontrol = 56/173, Ptrt < 0.05, Ptrial < 0.001 (Ptrt×trial > 0.05, removed from model); late summer 2006, nrapa = 73/370, ncontrol = 53/374, Ptrt > 0.05, Ptrial < 0.05, Ptrt×trial < 0.01. (B and C) Similar results were obtained in a second year. Early summer 2007, Prapa < 0.01, Ptrial < 0.001, Pmeth×diet < 0.05 (interactions P > 0.05 removed); late summer 2007, Prapa > 0.05, Ptrial < 0.05, Pmeth×diet < 0.05 (interactions P > 0.05 removed). (B) Proportion of bees that foraged before 10 days of age after combinatorial treatments with rapamycin and the JH analog methoprene. Data from individual trials are shown. Statistical analyses on data pooled from two early-summer trials and two late-season trials: Pmeth < 0.01, Prapa > 0.05, Pseason < 0.01, Prapa×season = 0.05 (interactions P > 0.05 removed). (C) Proportion of bees that foraged before 10 days of age after combinatorial treatments with rapamycin and adult diet manipulations (sugar only or pollen and honey). Data are from single early-summer and late-summer trials: Pdiet = 0.08, Prapa < 0.05, Pseason > 0.05, Prapa×season < 0.01 (interactions P > 0.05 removed). (D) Expression of ilp1 in brains of nurses and foragers collected from small colonies in early and late summer. ANOVA, followed by paired contrasts: PearlyFvs.lateF < 0.0001, PearlyNvs.lateN > 0.05 (early F, early foraging; late F, late foraging; early N, early nursing; late N, late nursing). (E) Expression of ilp1 in brains of nurses and foragers collected from large colonies in early and late summer. *, P < 0.05, ***, P < 0.001.
Fig. 3.
Fig. 3.
Citrate cycle genes are up-regulated in the brains of nurse bees. Gene expression in whole brains of nurse bees and foragers was measured on cDNA microarrays (37). Expression data were mapped to pathway diagrams compiled by KEGG. P values are based on ANOVA described in ref. . Abbreviations for gene names are based on SwissProt naming conventions. N.S., Not significant.

References

    1. Robinson GE, Ben-Shahar Y. Social behavior and comparative genomics: New genes or new gene regulation? Genes Brain Behav. 2002;1:197–203. - PubMed
    1. Carroll SB, Grenier JK, Weatherbee SD. From DNA to Diversity: Molecular Genetics and the Evolution of Animal Design. Malden, MA: Blackwell Publishing; 2005. p. 234.
    1. Robinson GE, Grozinger CM, Whitfield CW. Sociogenomics: social life in molecular terms. Nat Rev Genet. 2005;6:257–270. - PubMed
    1. Toth AL, Robinson GE. Evo-devo and the evolution of social behavior. Trends Genet. 2007;23:334–341. - PubMed
    1. Winston ML. The Biology of the Honey Bee. Cambridge, MA: Harvard Univ Press; 1987. p. 294.

Publication types