. 2008 Mar 18;105(11):4191-6.
doi: 10.1073/pnas.0710672105. Epub 2008 Mar 12.

Size, foraging, and food web structure

Affiliations

Size, foraging, and food web structure

Owen L Petchey et al. Proc Natl Acad Sci U S A. .

Abstract

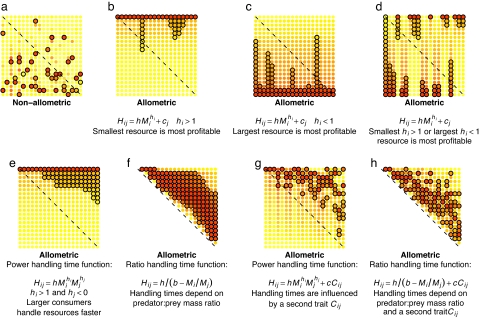
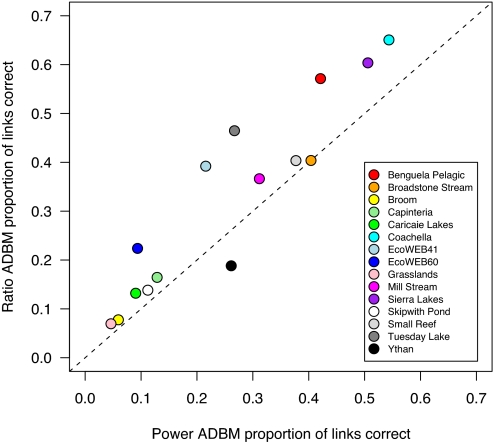
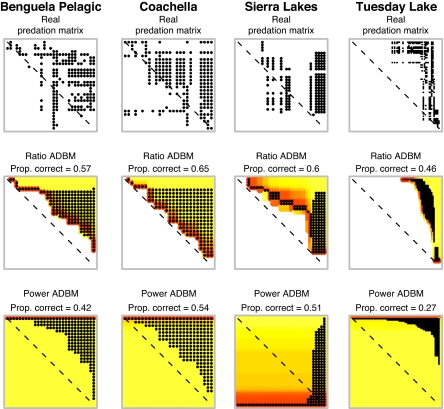
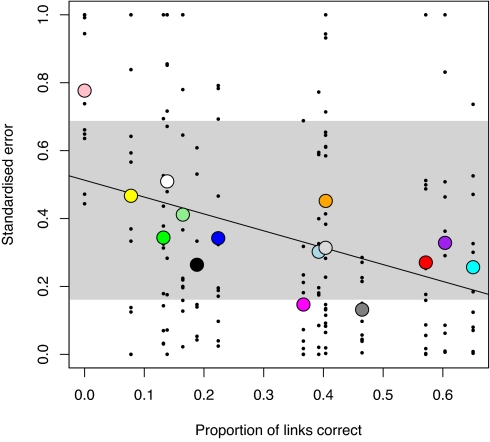
Understanding what structures ecological communities is vital to answering questions about extinctions, environmental change, trophic cascades, and ecosystem functioning. Optimal foraging theory was conceived to increase such understanding by providing a framework with which to predict species interactions and resulting community structure. Here, we use an optimal foraging model and allometries of foraging variables to predict the structure of real food webs. The qualitative structure of the resulting model provides a more mechanistic basis for the phenomenological rules of previous models. Quantitative analyses show that the model predicts up to 65% of the links in real food webs. The deterministic nature of the model allows analysis of the model's successes and failures in predicting particular interactions. Predacious and herbivorous feeding interactions are better predicted than pathogenic, parasitoid, and parasitic interactions. Results also indicate that accurate prediction and modeling of some food webs will require incorporating traits other than body size and diet choice models specific to different types of feeding interaction. The model results support the hypothesis that individual behavior, subject to natural selection, determines individual diets and that food web structure is the sum of these individual decisions.


Conflict of interest statement

The authors declare no conflict of interest.

Figures

Fig. 1.
Fig. 1.
Food web structures illustrated in predation matrices show the importance of allometry for structure. The allometric equation is given below the panel; parameter values are arbitrary and do not affect the qualitative patterns illustrated. Black circles indicate a realized feeding interaction. Body size increases from left to right and top to bottom, so that interactions in the upper-right triangle are for consumers feeding on resources smaller than themselves. Dashed diagonals lines indicate the position that cannibalistic interactions would take. Each element of the predation matrix is colored according to resource (row) profitability for the consumer (column) (yellow to red indicate low to high profitability, Ei/Hij). In g and h, no color indicates zero profitability. In b, c, and d, variation in diet breadth is caused by the effect of consumer identity (cj) on handling times; here, this effect is independent of consumer size.
Fig. 2.
Fig. 2.
Performance of the allometric diet breadth models (ADBM). Performance is measured as the proportion of correctly predicted feeding links. The ratio ADBM performs better than the power ADBM for 13 of the 15 modeled food webs. Paired t test: t = 3.6; df = 14; P = 0.003. The dashed line is the 1:1 relationship for reference.
Fig. 3.
Fig. 3.
Four real food webs and various models of them. Each predation matrix describes a food web, with resources in rows and consumers in columns. Body size increases from left to right and top to bottom. A black dot indicates the consumer in that column feeds upon the resource in that row. Hence, dots in the upper right triangle indicate feeding links where consumers are larger than their resources. The dashed diagonal line represents the position that cannibalistic links would occupy. Yellow to red indicate low to high resource profitability in the ADBM models. Here, consumer diets (columns of black dots) always include the darker red (most profitable) resources and extend by different amounts into yellows (less profitable resources). Ratio and power refer to the handling time allometries (see Materials and Methods). The predation matrices of all 15 real webs and their models are in SI Appendix.
Fig. 4.
Fig. 4.
Ability of the ADBM to predict food web structure. The standardized error in predicting 12 food web structural properties (listed in the SI Appendix) decreases with increases in the proportion of links correctly predicted. Large colored points are the mean standardized error of the ADBM for each web. Small black dots indicate the standardized error of each of the 12 properties for each web. Solid line is linear regression through the means (t = 3.0, df = 13, P = 0.01). The range of mean standardized error of the niche model (11) is shown by the vertical extent of the gray rectangle. The key in Fig. 2 applies.

Comment in

  • The "Goldilocks factor" in food webs.
    Berlow EL, Brose U, Martinez ND. Berlow EL, et al. Proc Natl Acad Sci U S A. 2008 Mar 18;105(11):4079-80. doi: 10.1073/pnas.0800967105. Epub 2008 Mar 11. Proc Natl Acad Sci U S A. 2008. PMID: 18334654 Free PMC article. No abstract available.

References

    1. Koh LP, et al. Species coextinctions and the biodiversity crisis. Science. 2004;305:1632–1634. - PubMed
    1. Kondoh M. Foraging adaptation and the relationship between food-web complexity and stability. Science. 2003;299:1388–1391. - PubMed
    1. Petchey OL, McPhearson PT, Casey TM, Morin PJ. Environmental warming alters food-web structure and ecosystem function. Nature. 1999;402:69–72.
    1. Knight TM, McCoy MW, Chase JM, McCoy KA, Holt RD. Trophic cascades across ecosystems. Nature. 2005;437:880–883. - PubMed
    1. Paine RT. Trophic control of production in a rocky intertidal community. Science. 2002;296:736–739. - PubMed

Publication types