. 2008 May;82(10):5043-53.
doi: 10.1128/JVI.01548-07. Epub 2008 Mar 12.

Identification and in vitro expansion of functional antigen-specific CD25+ FoxP3+ regulatory T cells in hepatitis C virus infection

Affiliations

Identification and in vitro expansion of functional antigen-specific CD25+ FoxP3+ regulatory T cells in hepatitis C virus infection

Hirotoshi Ebinuma et al. J Virol. 2008 May.

Abstract

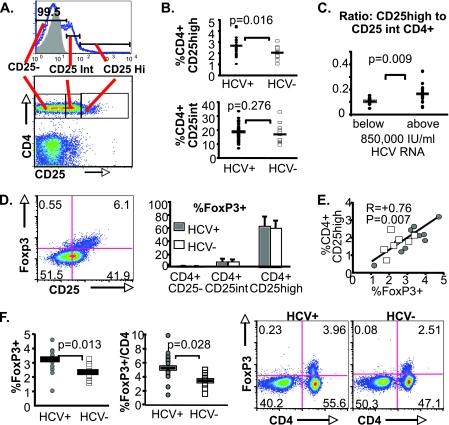
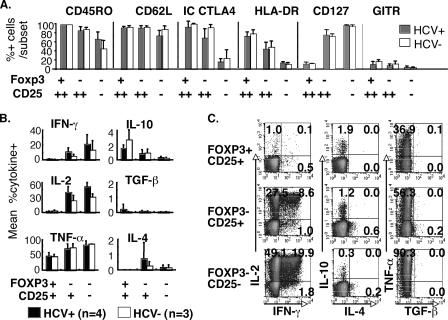
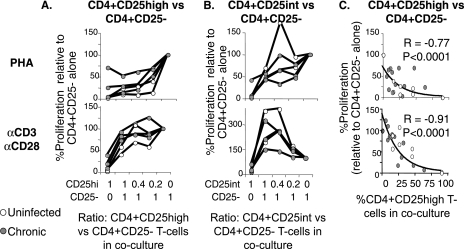
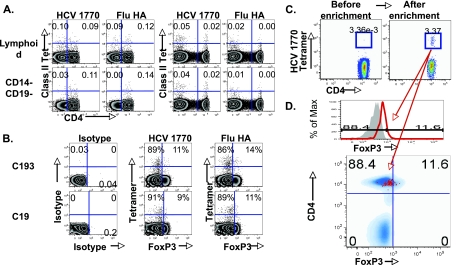
CD4(+)CD25(+) regulatory T cells (CD25(+) Tregs) play a key role in immune regulation. Since hepatitis C virus (HCV) persists with increased circulating CD4(+)CD25(+) T cells and virus-specific effector T-cell dysfunction, we asked if CD4(+)CD25(+) T cells in HCV-infected individuals are similar to natural Tregs in uninfected individuals and if they include HCV-specific Tregs using the specific Treg marker FoxP3 at the single-cell level. We report that HCV-infected patients display increased circulating FoxP3(+) Tregs that are phenotypically and functionally indistinguishable from FoxP3(+) Tregs in uninfected subjects. Furthermore, HCV-specific FoxP3(+) Tregs were detected in HCV-seropositive persons with antigen-specific expansion, major histocompatibility complex class II/peptide tetramer binding affinity, and preferential suppression of HCV-specific CD8 T cells. Transforming growth factor beta contributed to antigen-specific Treg expansion in vitro, suggesting that it may contribute to antigen-specific Treg expansion in vivo. Interestingly, FoxP3 expression was also detected in influenza virus-specific CD4 T cells. In conclusion, functionally active and virus-specific FoxP3(+) Tregs are induced in HCV infection, thus providing targeted immune regulation in vivo. Detection of FoxP3 expression in non-HCV-specific CD4 T cells suggests that immune regulation through antigen-specific Treg induction extends beyond HCV.


Figures

FIG. 1.
FIG. 1.
Increased CD4+CD25high T-cell frequency in HCV-infected subjects reflects increased FoxP3+ CD4 T-cell frequency. (A) Representative staining characteristics and gating strategies are shown for CD25high, CD25int, and CD25 CD4 T-cell subsets in PBMC (gating on lymphoid cells based on forward and side scatter characteristics). CD25 positivity was defined by a fluorescence cutoff below which 99.9% of isotype-stained cells were negative. CD4+CD25+ T cells were separated into CD25high or intermediate cells at a point where most CD4-negative cells lost CD25 expression. (B, top) CD4+CD25high T-cell frequencies, expressed as percentages, in 35 chronically HCV-infected (HCV+) and 15 uninfected subjects (HCV−) (mean, 2.6% versus 2.0%). (Bottom) Percentages of CD4+CD25int T cells in HCV-infected and uninfected subjects (mean, 18.6% versus 17.1%). Horizontal bars indicate mean values. (C) Ratios between CD4+CD25high and CD4+CD25int T-cell frequencies in HCV-infected patients with HCV RNA titers below or above 850,000 IU/ml (the upper limit of the HCV reverse transcription-PCR assay) (mean, 0.17 versus 0.11). (D) Representative FACS density plots showing intracellular FoxP3 protein expression primarily in CD25+ lymphocytes ex vivo. The bar graph shows mean % FoxP3+ cells among CD4+CD25high, CD4+CD25int, and CD4+CD25 T-cell subsets (58% versus 6% versus 1%; P < 0.001 [Friedman test]). There were no differences in % FoxP3 expression between the chronically HCV-infected (n = 12) and uninfected (n = 8) subjects for any of the T-cell subsets (P not significant). Error bars indicate standard deviations. Similar patterns were shown for FoxP3 mRNA expression in FACS-sorted CD4+CD25high, CD4+CD25int, and CD4+CD25 T cells (data not shown). (E) Correlation between circulating FoxP3+ and CD4+CD25high T-cell frequencies (R = +0.76; P = 0.007 [Spearman rank correlation]). Gray circles represent data points from chronically HCV-infected subjects, and unfilled squares represent data points from uninfected controls. (F) Chronically HCV-infected patients (n = 14) display greater FoxP3+ T-cell frequencies ex vivo than uninfected controls (n = 9) (mean % FoxP3+ per lymphoid cell, 3.1% versus 2.3%; P = 0.013; mean % FoxP3+ per CD4 T cell, 5.5% versus 3.7%; P = 0.028 [Mann-Whitney U]). Multicolor plots show the expression of FoxP3 in CD4 T cells.
FIG. 2.
FIG. 2.
FoxP3+ CD4+ T cells from HCV-infected and uninfected subjects display similar phenotype and anergic cytokine profiles. (A) Mean percentages of CD45RO+, CD62L+, intracellular (IC) CTLA4+, HLA-DR+, CD127+, and GITR+ cells in three CD4+ T-cell subsets (FoxP3+ CD25high, FoxP3 CD25high, and FoxP3 CD25) are shown, with standard deviations indicated by error bars (HCV+, infected subjects; HCV−, uninfected controls) based on data from 14 HCV+ and 7 HCV subjects. No significant differences between HCV-infected and uninfected subjects for each of these markers are observed. (B) Mean percentages of cytokine+ cells are shown within FoxP3+ CD25+, FoxP3 CD25+, and FoxP3 CD25 CD4 T-cell subsets following PMA-ionomycin stimulation. Error bars indicate standard deviations. Cytokine profiles for FoxP3+ CD25+ and FoxP3 CD25+ CD4 T cells were determined in the autoMACS-sorted CD4+CD25+ T-cell subset; cytokine profiles for FoxP3 C25 T cells were determined in the autoMACS-sorted CD4+CD25 T-cell subset. (C) Representative FACS density plots for intracellular cytokine staining (IFN-γ, IL-2, IL-4, IL-10, TGF-β, and TNF-α) following PMA-ionomycin stimulation in FoxP3+ CD25+, FoxP3 CD25+, and FoxP3 CD25 T-cell subsets from an HCV-infected subject. Longer stimulation with PMA-ionomycin or stimulation with HCV-derived proteins did not enhance IL-10 or TGF-β production by sorted CD4+CD25+ T-cell subsets based on cytokine bead array (IL-10) or enzyme-linked immunosorbent assay (TGF-β) (data not shown).
FIG. 3.
FIG. 3.
CD4+CD25high T cells from HCV-infected and uninfected subjects display similar levels of dose-dependent suppression following polyclonal stimulation. (A and B) Proliferative capacities of CD4+CD25 responder cells alone and with autologous FACS-sorted CD4+CD25+ T-cell subsets following PHA or anti (α)-CD3/anti-CD28 stimulation at CD25+/CD25 T-cell ratios of 1:0, 1:1, 0.4:1, 0.2:1, and 0:1. The y axis shows the SIs from CD25+/CD25 cocultures divided by the SI from CD4+CD25 T cells stimulated alone. The graphs represent data from three chronically HCV-infected and two uninfected control subjects. (C) Percent proliferation (relative to that for CD4+CD25 responder T cells stimulated alone) shows a tight inverse correlation with the actual CD4+CD25high T-cell content in each coculture. Values were calculated based on the purity of the FACS-sorted CD4+CD25high subset. (Top) PHA. (Bottom) Anti-CD3/anti-CD28.
FIG. 4.
FIG. 4.
HCV-specific expansion of FoxP3+ Tregs in vitro from HCV-seropositive persons. (A) Antigen-specific expansion with CFSE dilution and FoxP3 expression (gated on CD4 T cells) by FACS in CFSE-labeled PBMC following stimulation with SOD, recombinant HCV NS3/4 and NS5 proteins, and tetanus toxoid in the presence of 1,000 U/ml rIL-2 and 10 μg/ml of soluble anti-CD28 alone (−TGF-β), with 10 ng/ml TGF-β (+TGFβ) or 1 μM SD-208, a type I receptor kinase inhibitor which inhibits TGF-β signaling (i-TGFβ). Results are shown for three representative HCV-seropositive subjects: C98 and C107, with chronic infection, and R58, with spontaneous HCV clearance. Numbers in the upper left quadrants represent percentages for FoxP3+ CFSElow CD4 cells (i.e., expanded FoxP3+ CD4+ T cells). Increased FoxP3+ CFSElow cell frequencies at least 1% above the background for SOD are underlined. (B) Percentages of IFN-γ and TNF-α production by intracellular cytokine staining following HCV NS3/4 and PMA-ionomycin stimulation of FoxP3+ and FoxP3 CD4 T cells in PBMC cultures stimulated for 14 days with recombinant HCV NS3/4 protein with rIL-2 and anti-CD28. (C) Phenotypes of FoxP3+ and FoxP3 CD4 T cells in 14-day Treg cultures expanded with HCV NS3/4 protein, high-dose rIL-2, and anti-CD28.
FIG. 5.
FIG. 5.
HCV specificity of expanded FoxP3+ Tregs demonstrated by MHC-II peptide tetramers. (A) Antigen specificities for HLA DRB1*04-restricted class II tetramers bound to influenza virus hemagglutinin (Flu HA), HCV NS3 1248, and HCV NS4 1770 epitopes in short-term peptide-stimulated T-cell lines are shown. (B) Specific binding of class II tetramers is shown by staining an HCV NS3/4-stimulated T-cell line with isotype antibody, HCV NS4 1770 tetramer, and influenza virus HA-specific tetramer. An HCV NS3/4-specific T-cell line binds HCV 1770 but not influenza virus HA tetramer. (C) Expansion of HCV-specific FoxP3+ CD4 T cells in vitro. CFSE-labeled PBMC from a DRB1*04+ HCV-seropositive subject (R19) were stimulated with recombinant HCV NS3/4 protein, with the expansion of FoxP3+ CD4 T cells (left panels) and HCV-specific (but not influenza virus HA-specific) DRB1*04-restricted class II tetramer+ CD4 T cells (middle three panels). Circled gates indicate class II tetramer+ CFSElow CD4 T cells that divided following antigenic stimulation. FACS plots on the far right show FoxP3 expression in the gated HCV 1770-specific CFSElow CD4 T cells. (D) FoxP3 expression by influenza virus HA tetramer+ CD4 T cells is shown in CFSE-labeled PBL following antigenic influenza virus HA peptide stimulation (gated on CD4 T cells on the upper graph) is shown. (Bottom) FoxP3 expression by 51% of gated CFSElow influenza virus tetramer (Tet)+ CD4 T cells in an overlay with total CD4.
FIG. 6.
FIG. 6.
Detection of antigen-specific FoxP3+ CD4 T cells ex vivo. (A) Staining strategy to reduce nonspecific background staining for class II tetramers. CD4 and class II tetramer staining characteristics for freshly isolated PBL in subjects with and without the HLA DRB1*04 allele are shown. Top graphs represent 7-amino-actinomycin-negative cells with lymphoid gate based on forward and side scatter characteristics. Bottom graphs represent lymphoid cells with further exclusion of CD14+ and/or CD19+ cells. Flu HA, influenza virus HA. (B) FoxP3 expression in antigen-specific CD4 T cells ex vivo. FoxP3 expression relative to HCV 1770 and influenza virus-specific class II tetramer staining is shown for two patients with chronic HCV infection (C193 and C19). Percentages show relative FoxP3 expression among tetramer+ cells. (C) Enrichment of HCV NS4 1770-specific class II tetramer+ CD4 T cells by magnetic beads using freshly isolated PBMC from an HCV-seropositive subject (17, 33), gating on CD4+ CD14 CD19 Viaprobe lymphoid cells. The multicolor FACS plots show that an obvious cluster of tetramer+ CD4 T cells can be seen after (3.37%) but not before (0.00336%) tetramer enrichment (tetramer+ CD4+; boxes). (D) FoxP3 expression in gated HCV NS4 1770-specific class II tetramer+ CD4 T cells following enrichment. The upper histogram of tetramer+ CD4+ T cells shows that 11.6% of gated HCV 1770-specific tetramer+ CD4+ T cells (red line) are FoxP3+, based on the cutoff below which 99.8% of the isotype antibody-stained control sample (gray shaded region) is negative. The lower FACS plot shows FoxP3 expression by gated tetramer+ CD4+ T cells overlaid onto a density plot for CD14 CD19 7-amino-actinomycin-negative lymphocytes. Specifically, 11 events were positive for FoxP3, compared to 84 events negative for FoxP3.
FIG. 7.
FIG. 7.
HCV-specific CD8 T-cell suppression by in vitro-expanded HCV-specific CD4+CD25+ T cells. (A) HCV NS3 1406-specific CD8 T cells demonstrated directly ex vivo by class I tetramer staining in HCV-seropositive HLA-A2+ subject R23. Efficient antigen-specific expansion occurred following 7 days of in vitro stimulation with overlapping NS3-derived HCV peptides. (B) The top three FACS plots demonstrate preferential expansion of HCV-specific FoxP3+ CD4+ Tregs by day 14 following in vitro stimulation with recombinant NS3/4 protein, 1,000 U/ml rIL-2, and 10 μg/ml soluble anti-CD28 alone (NS3/4, 27.2% FoxP3+ CD4+) and with added TGF-β (NS3/4 plus TGF-β, 51.4% FoxP3+ CD4+), compared to control SOD (7.5% FoxP3+ CD4+). The bottom three graphs show FoxP3+ CD25+ T-cell content in autoMACS-sorted CD4+CD25+ (eTregs) and CD4+CD25 (eCD25) subsets from the expanded Treg cultures. (C) CD8+ T-cell expansion is shown by histograms representing CFSE dilution on day 7 in PBMC stimulated alone or with added eTregs isolated from the NS3/4-stimulated Treg cultures in panel B. The stimulating condition is indicated above each set of graphs. The ratios between eTreg and PBL are indicated below the graphs. (D) HCV-specific CD8+ T-cell expansion in PBL was directly monitored by a class I tetramer specific for HCV NS3 1406-specific CD8 T cells in the presence of NS3/4-expanded eTregs at various eTreg/PBL ratios (0:1, 0:25:1, and 1:1). Assays using eTregs expanded with TGF-β are indicated by 1:0.25T and 1:1T. The graphs at the extreme right represent assays in which CD4+CD25 T cells are sorted from expanded Treg culture (eCD25) and added at 1:1 ratio to PBL before antigenic stimulation with the NS3 peptide (top) or with anti-CD3/anti-CD28 stimulation (bottom).

Similar articles

Cited by

References

    1. Akbar, A. N., M. Vukmanovic-Stejic, L. S. Taams, and D. C. Macallan. 2007. The dynamic co-evolution of memory and regulatory CD4+ T cells in the periphery. Nat. Rev. Immunol. 7231-237. - PubMed
    1. Alatrakchi, N., C. S. Graham, J. Van der Vliet, K. E. Sherman, M. A. Exley, and M. J. Koziel. 2007. Hepatitis C virus (HCV)-specific CD8+ cells produce transforming growth factor β that can suppress HCV-specific T-cell responses. J. Virol. 815882-5892. - PMC - PubMed
    1. Allan, S. E., S. Q. Crome, N. K. Crellin, L. Passerini, T. S. Steiner, R. Bacchetta, M. G. Roncarolo, and M. K. Levings. 2007. Activation-induced FOXP3 in human T effector cells does not suppress proliferation or cytokine production. Int. Immunol. 19345-354. - PubMed
    1. Asseman, C., S. Mauze, M. W. Leach, R. L. Coffman, and F. Powrie. 1999. An essential role for interleukin 10 in the function of regulatory T cells that inhibit intestinal inflammation. J. Exp. Med. 190995-1004. - PMC - PubMed
    1. Baecher-Allan, C., J. A. Brown, G. J. Freeman, and D. A. Hafler. 2001. CD4+CD25high regulatory cells in human peripheral blood. J. Immunol. 1671245-1253. - PubMed

Publication types

MeSH terms

Substances