. 2008 May;82(10):4931-7.
doi: 10.1128/JVI.02127-07. Epub 2008 Mar 12.

The early kinetics of cytomegalovirus-specific CD8+ T-cell responses are not affected by antigen load or the absence of perforin or gamma interferon

Affiliations

The early kinetics of cytomegalovirus-specific CD8+ T-cell responses are not affected by antigen load or the absence of perforin or gamma interferon

Daniel M Andrews et al. J Virol. 2008 May.

Abstract

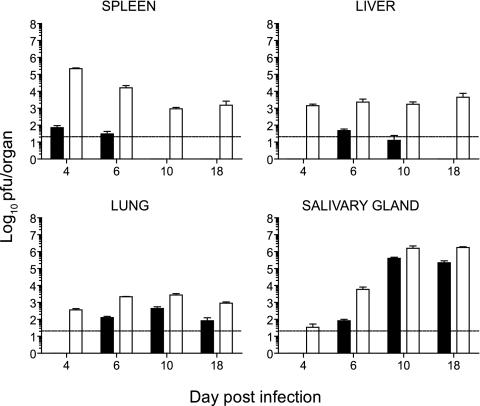
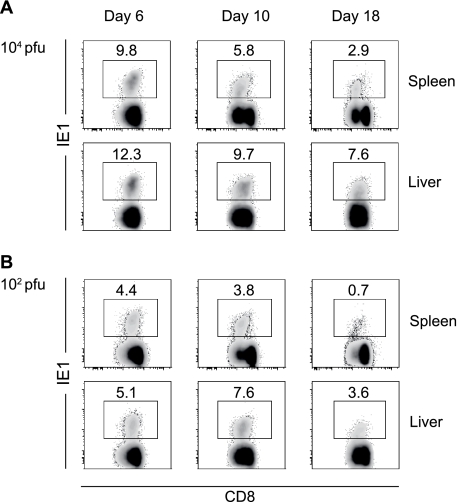
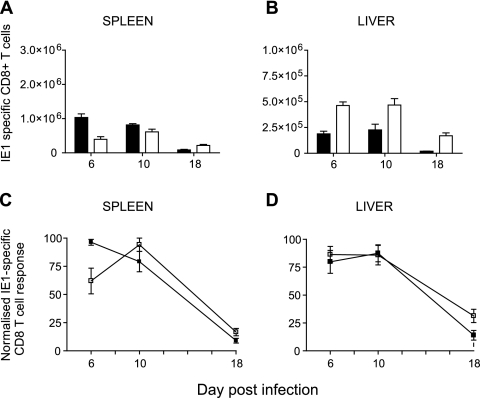
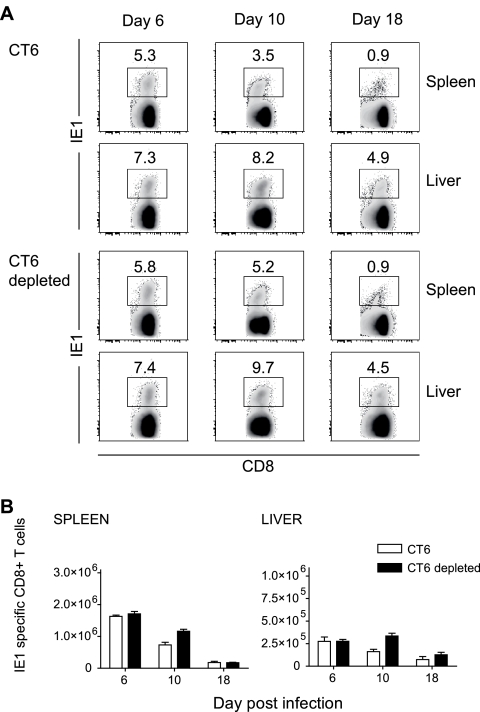
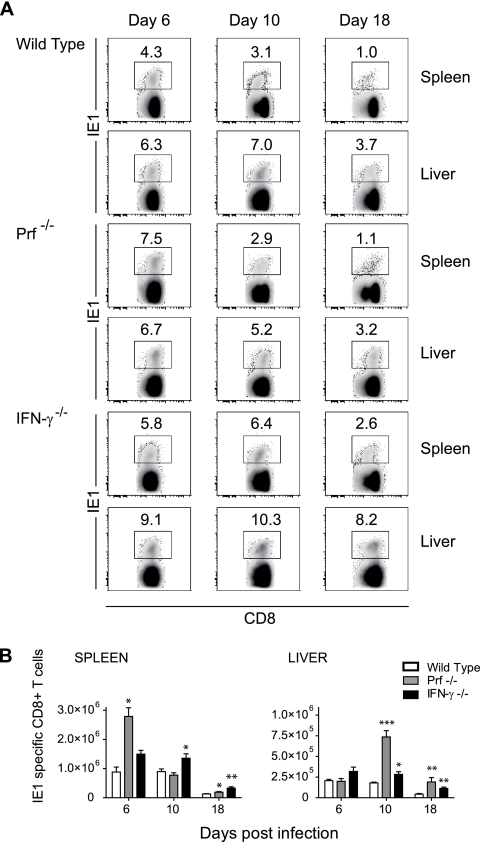
Both innate and adaptive immune responses participate in the control of murine cytomegalovirus (mCMV) infection. In some mouse strains, like BALB/c, the control of infection relies on the activities of CD8(+) T cells. mCMV-specific CD8(+) T-cell responses are unusual in that, even after mCMV has been controlled in the periphery, the numbers of circulating virus-specific CD8(+) T cells remain high compared to those observed in other viral infections. To better understand the generation and maintenance of mCMV-specific CD8(+) T-cell responses, we evaluated how antigen load and effector molecules, such as perforin (Prf) and gamma interferon (IFN-gamma), influence these responses during acute infection in vivo. Viral burden affected the magnitude, but not the early kinetics, of antigen-specific CD8(+) T-cell responses. Similarly, the magnitude of virus-specific CD8(+) T-cell expansion was affected by Prf and IFN-gamma, but contraction of antigen-specific responses occurred normally in both Prf- and IFN-gamma-deficient mice. These data indicate that control of mCMV-specific CD8(+) T-cell expansion and contraction is more complex than anticipated and, despite the role of Prf or IFN-gamma in controlling viral replication, a full program of T-cell expansion and contraction can occur in their absence.


Figures

FIG. 1.
FIG. 1.
Viral titers in BALB/c mice following infection with 102 or 104 PFU of mCMV. Mice were infected with 102 (black bars) or 104 (white bars) PFU of mCMV, and spleen, liver, lung, and salivary gland titers were determined at various times after infection. The data presented are the means ± SE of five mice. Data are representative of at least two independent experiments. Viral titers were significantly different between 102 and 104 PFU infections at all time points in the spleen, liver, and lung (P < 0.005, except for day 10 results for the liver [P < 0.05]). In the salivary gland viral titers were significantly different at days 6 (P < 0.05) and 18 (P < 0.005).
FIG. 2.
FIG. 2.
Frequency of IE1-specific CD8+ T cells following infection of mice with 104 (A) or 102 (B) PFU of mCMV. Spleens and livers were harvested at days 6, 10, and 18 postinfection, and the frequency of IE1-specific T cells was determined by FACS staining with TCRβ-APC, CD8α-APC-Cy7, and H2-Ld IE tetramer-PE. Numbers in density plots indicate the frequencies of IE1-specific cells in the CD8+ T-cell pool. Density plots are representative of results observed in six mice from three independent experiments.
FIG. 3.
FIG. 3.
Kinetics of mCMV IE1-specific CD8+ T-cell responses in the spleen and liver. (A and B) The total number of IE1-specific CD8+ T cells in the spleens (A) and livers (B) of mice infected with 102 (black bars) or 104 (white bars) PFU of mCMV is presented as the combined data from two experiments with three mice per time point. Means ± SE are shown. (C and D) Kinetics of the response in the spleen (C) and liver (D) are shown as normalized IE1-specific CD8+ T-cell responses; the data are presented as a percentage, with the maximal number of IE1-specific CD8+ T cells set as 100%. Responses for mice infected with 102 (black squares) or 104 (white squares) PFU mCMV are shown. Combined data from two experiments with three mice per time point are presented. Means ± SE are shown.
FIG. 4.
FIG. 4.
Frequencies and numbers of IE1-specific CD8+ T cells in the spleens and livers of mice lacking NK cells. CT6 mice treated with an irrelevant immunoglobulin or with the anti-NK1.1 PK136 monoclonal antibody prior to infection with 102 PFU mCMV were used for these experiments. (A) Frequencies of IE1-specific CD8+ T cells at days 6, 10, and 18 after infection were determined by FACS staining with TCRβ-APC, CD8α-APC-Cy7, and H2-Ld IE tetramer-PE. Numbers in the density plots indicate the mean frequencies of IE1+ cells in the CD8 T-cell pool. Density plots are representative of six mice from two independent experiments with three mice per group. (B) Numbers of IE1-specific CD8+ T cells at days 6, 10, and 18 after infection; numbers represent the means ± SE of five to six mice from two independent experiments.
FIG. 5.
FIG. 5.
Frequencies and numbers of IE1-specific CD8+ T cells in the spleens and livers of mice lacking IFN-γ or Prf. BALB/c mice (wild type) or BALB/c mice lacking either IFN-γ (IFN-γ−/−) or Prf (Prf−/−) were infected with 102 PFU mCMV. (A) Frequencies of IE1-specific CD8+ T cells at days 6, 10, and 18 after infection were determined by FACS staining with TCRβ-APC, CD8α-APC-Cy7, and H2-Ld IE tetramer-PE. Numbers in the density plots indicate the mean frequency of IE1+ cells in the CD8 T-cell pool. (B) Numbers of IE1-specific CD8+ T cells in the spleen and liver at days 6, 10, and 18 after infection; numbers represent the means ± SE of six mice from two independent experiments for all times, except for day 6. *, P < 0.02; **, P < 0.005; ***, P < 0.0005.

References

    1. Andrews, D. M., C. E. Andoniou, F. Granucci, P. Ricciardi-Castagnoli, and M. A. Degli-Esposti. 2001. Infection of dendritic cells by murine cytomegalovirus induces functional paralysis. Nat. Immunol. 21077-1084. - PubMed
    1. Badovinac, V. P., and J. T. Harty. 2006. Programming, demarcating, and manipulating CD8+ T-cell memory. Immunol. Rev. 21167-80. - PubMed
    1. Badovinac, V. P., B. B. Porter, and J. T. Harty. 2004. CD8+ T cell contraction is controlled by early inflammation. Nat. Immunol. 5809-817. - PubMed
    1. Badovinac, V. P., B. B. Porter, and J. T. Harty. 2002. Programmed contraction of CD8+ T cells after infection. Nat. Immunol. 3619-626. - PubMed
    1. Badovinac, V. P., A. R. Tvinnereim, and J. T. Harty. 2000. Regulation of antigen-specific CD8+ T cell homeostasis by perforin and interferon-gamma. Science 2901354-1358. - PubMed

Publication types