. 2008 May;82(10):4697-705.
doi: 10.1128/JVI.02698-07. Epub 2008 Mar 12.

Generation of antiviral major histocompatibility complex class I-restricted T cells in the absence of CD8 coreceptors

Affiliations

Generation of antiviral major histocompatibility complex class I-restricted T cells in the absence of CD8 coreceptors

Nicolas P Andrews et al. J Virol. 2008 May.

Abstract

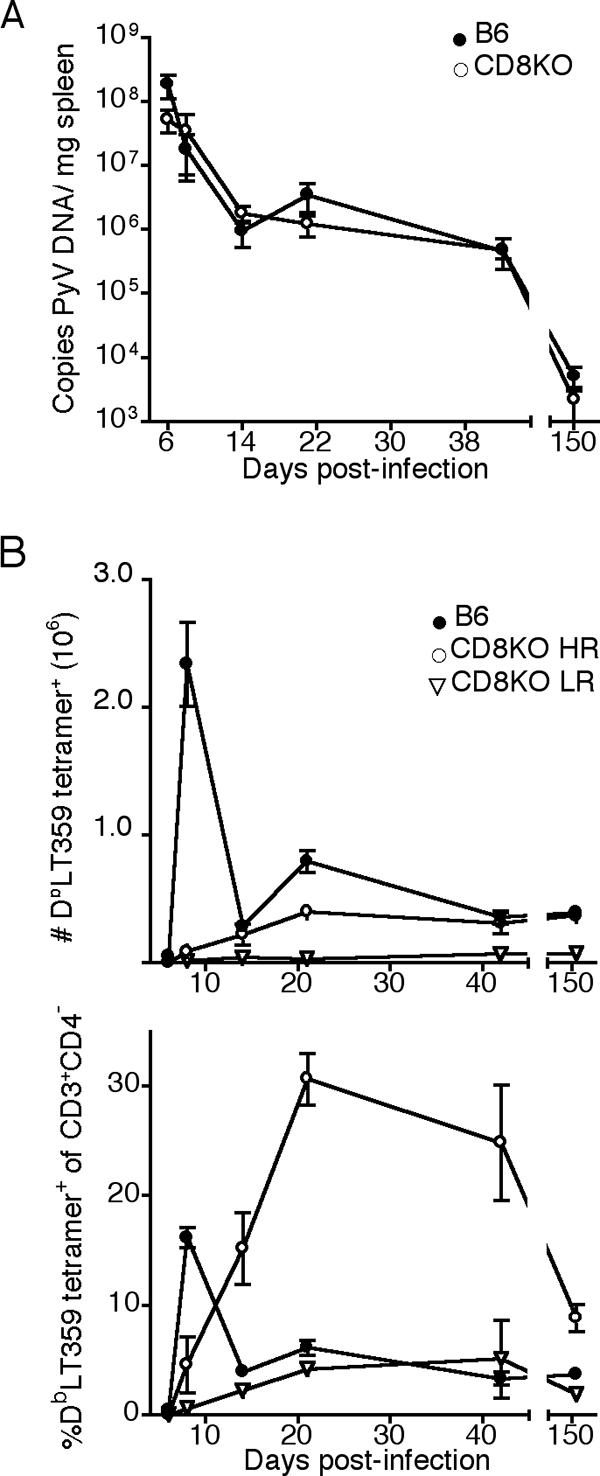
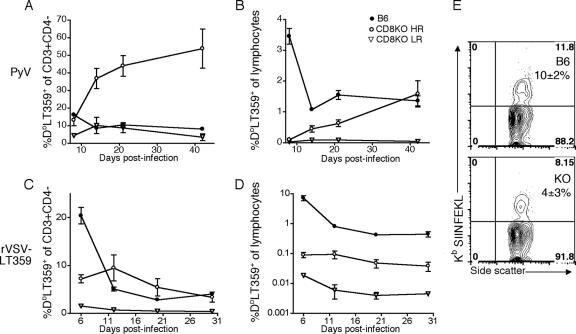
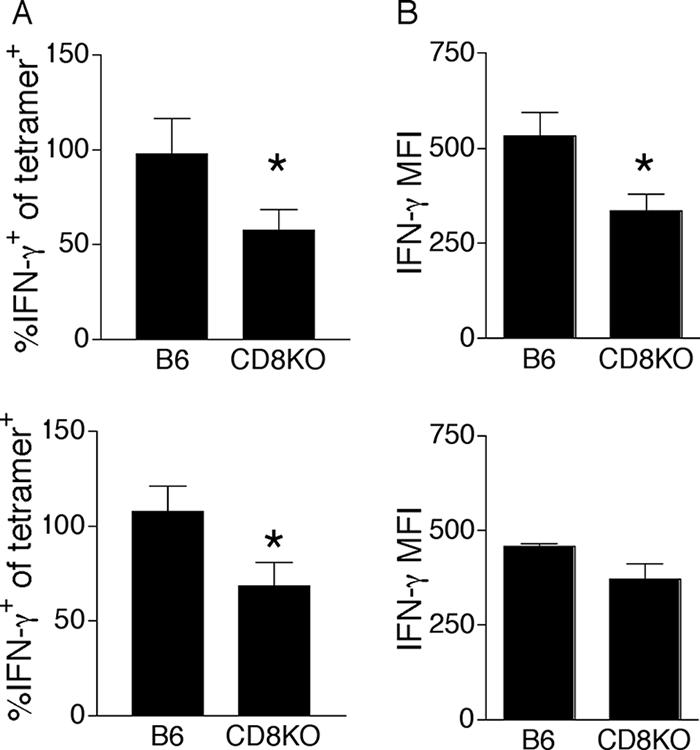
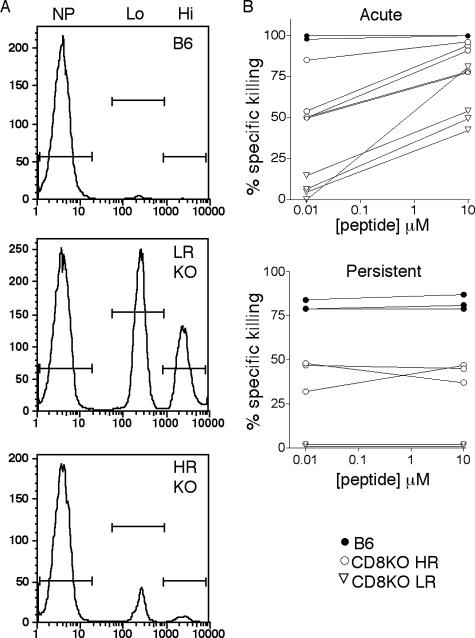
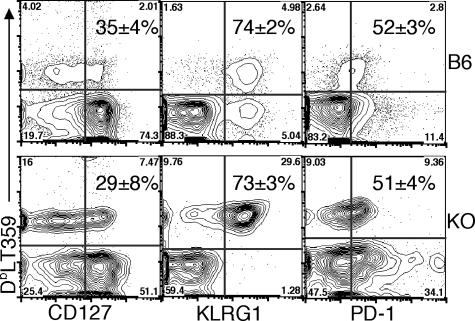
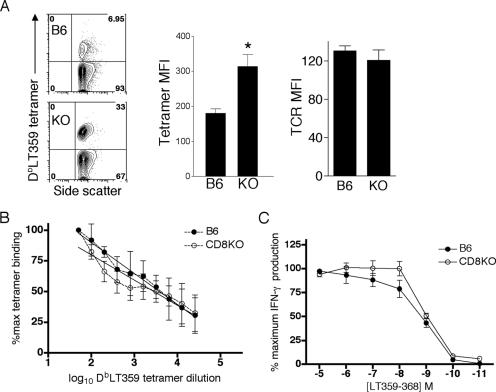
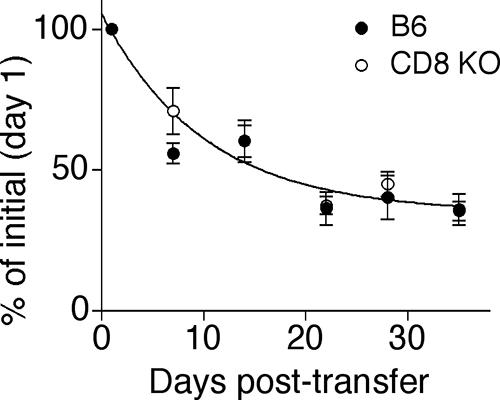
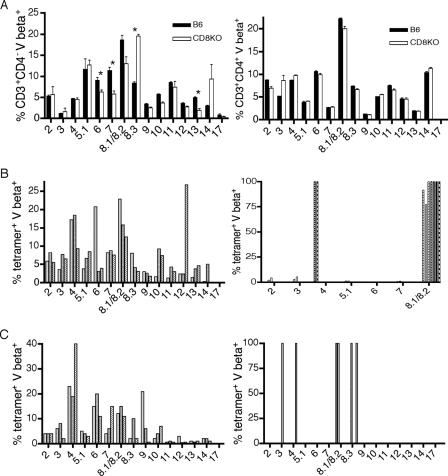
The CD8 coreceptor is important for positive selection of major histocompatibility complex I (MHC-I)-restricted thymocytes and in the generation of pathogen-specific T cells. However, the requirement for CD8 in these processes may not be essential. We previously showed that mice lacking beta(2)-microglobulin are highly susceptible to tumors induced by mouse polyoma virus (PyV), but CD8-deficient mice are resistant to these tumors. In this study, we show that CD8-deficient mice also control persistent PyV infection as efficiently as wild-type mice and generate a substantial virus-specific, MHC-I-restricted, T-cell response. Infection with vesicular stomatitis virus (VSV), which is acutely cleared, also recruited antigen-specific, MHC-I-restricted T cells in CD8-deficient mice. Yet, unlike in VSV infection, the antiviral MHC-I-restricted T-cell response to PyV has a prolonged expansion phase, indicating a requirement for persistent infection in driving T-cell inflation in CD8-deficient mice. Finally, we show that the PyV-specific, MHC-I-restricted T cells in CD8-deficient mice, while maintained long term at near-wild-type levels, are short lived in vivo and have extremely narrow T-cell receptor repertoires. These findings provide a possible explanation for the resistance of CD8-deficient mice to PyV-induced tumors and have implications for the maintenance of virus-specific MHC-I-restricted T cells during persistent infection.


Figures

FIG. 1.
FIG. 1.
CD8KO mice control PyV infection and generate PyV-specific, MHC-I-restricted, T-cell responses. B6 and CD8KO mice received 2 × 10⁶ PFU of PyV s.c. (A) Splenic PyV DNA copy number at the indicated day p.i. (B) Number (top panel) and frequency (bottom panel) of splenic CD3+CD4 DbLT359 tetramer+ T cells at the indicated day p.i. Data are the means for three (B6) or six (CD8KO) mice per group and are representative of two (A) or three (B) experiments.
FIG. 2.
FIG. 2.
Differences between PyV and VSV infection in the pattern of Ag-specific, MHC-I-restricted, T-cell responses in CD8KO mice. B6 and CD8KO mice received 2 × 10⁶ PFU of PyV s.c. or 1 × 10⁶ PFU of rVSV-LT359 i.v. CD3+CD4DbLT359 tetramer+ cells were tracked in the blood of PyV-infected mice (A and B) or rVSV-LT359-infected mice (C and D) and were graphed as a frequency of total CD3+CD4 T cells or total lymphocytes. (E) B6 (top panel) and CD8KO mice (bottom panel) were infected with 2 × 10⁶ PFU of PyV.OVA-I s.c. At day 8 p.i., frequencies of CD3+CD4KbSIINFEKL tetramer+ cells in the blood were determined. The mean ± standard deviation of tetramer+ cells is indicated. Data are the means for three (B6) or six (CD8KO) mice per group and are representative of two (A to D) or one (E) experiment.
FIG. 3.
FIG. 3.
Partial dysfunction by PyV-specific MHC-I-restricted T cells in CD8KO mice. Spleen cells from mice infected 21 days (top panel) or 6 weeks (bottom panel) previously were stimulated with LT359 peptide (1.0 μM) and stained intracellularly for IFN-γ. The data are represented as the percentage of CD3+CD4 DbLT359 tetramer+ cells producing IFN-γ (A) and the MFI of IFN-γ staining (B). *, P value was ≤0.05. Data are the means for three to five mice per group and are representative of two experiments at each time point. Error bars indicate standard deviations.
FIG. 4.
FIG. 4.
MHC-I-restricted in vivo killing of peptide-pulsed targets by PyV-infected B6 and CD8KO mice. Naïve B6 spleen cells were pulsed with low (10 nM) or high (10 μM) concentrations of LT359 peptide or were left unpulsed. After PKH and CFSE labeling, the cells were injected i.v. into naïve B6 mice or B6 and CD8KO (KO) mice infected 21 days (acute) or 6 weeks (persistent) previously. After 4 h, spleens were analyzed by flow cytometry for remaining target cells. (A) Representative histograms for B6 mice and for LR and HR CD8KO mice gated on PKH+ spleen cells showing no peptide (NP), low-peptide (Lo), and high-peptide (Hi) populations. (B) Specific killing of peptide-pulsed targets versus peptide concentration during acute (top panel) and persistent (bottom panel) PyV infection. Data for day 21 p.i. are for B6 (n = 6) and CD8KO (n = 8) mice from two independent experiments. Data for 6 weeks p.i. are for three to five mice per group and are representative of two experiments.
FIG. 5.
FIG. 5.
Phenotypic analysis of PyV-specific MHC-I-restricted T cells in B6 and CD8KO mice. Representative plots show CD127, KLRG-1, and PD-1 expression on CD3+CD4DbLT359 tetramer+ spleen cells from B6 and CD8KO (KO) mice on day 21 p.i. Numbers indicate the means ± standard deviations of tetramer+ cells expressing the given activation marker. Data are the means for three (B6) or four (CD8KO) mice and are representative of two independent experiments.
FIG. 6.
FIG. 6.
Assessment of LT359-specific T-cell avidity of B6 and CD8KO mice. (A) Representative plots (left panel) of CD3+CD4 DbLT359 tetramer+ spleen cells, with means ± standard deviations of tetramer MFI (middle panel) and TCRβ-chain MAb (right panel) MFI of CD3+CD4 DbLT359 tetramer+ spleen cells at day 21 p.i. KO, CD8KO mice. *, P value was ≤0.05. (B) Spleen cells were stained with twofold serial dilutions of DbLT359 tetramer plus anti-CD3 and anti-CD4. The frequency of tetramer binding at each dilution was normalized to the percentage of binding at the lowest dilution. The data show an equivalent fit with both linear and nonlinear regression models, so the simpler linear model was selected (R2 − B6 = 0.804; R2 − KO = 0.713) which returned a common slope (−22.3) and y intercept (128.4). (C) Spleen cells were stimulated with the indicated concentrations of LT359 peptide and surface stained for CD3 and CD4 and intracellularly for IFN-γ. Data were normalized to the frequency of IFN-γ+ cells stimulated with 10 μM peptide. The LT359 peptide concentrations that elicited 50% IFN-γ production were 1.23 nM (B6) and 0.96 nM (CD8KO). Data are the means for three or four mice and are representative of two independent experiments. Error bars indicate standard deviations.
FIG. 7.
FIG. 7.
Maintenance of LT359-specific T cells in B6 and CD8KO mice. At three weeks p.i., CFSE-labeled B6 and CD8KO spleen cells were transferred to infection-matched hosts and frequencies of CD3+ donor cells were tracked over time. The shared survival curve obtained by nonlinear regression analysis is shown. Values represent the means ± standard errors (error bars) of the means for three or four mice per group and are representative of two independent experiments.
FIG. 8.
FIG. 8.
Vβ TCR repertoire analysis of naïve and LT359-specific T cells from B6 and CD8KO mice. Spleen cells were stained with DbLT359 tetramer, anti-CD3, anti-CD4, and the indicated Vβ TCR MAbs. (A) Naïve CD3+CD4 (left panel) or CD3+CD4+ (right panel) T cells. (B) CD3+CD4 T cells at day 21 post-PyV infection from B6 (left panel) or CD8KO (right panel) mice. All commercially available MAbs specific for TCR Vβ chains were tested. For the sake of clarity, Vβ chains 8.3 through 17 are not shown, as they were not expressed by CD8-deficient LT359-specific T cells at day 21 p.i. (C) CD3+CD4 T cells at 6 weeks post-PyV infection from B6 (left panel) or CD8KO (right panel) mice. *, P value was ≤0.05. Data for naïve mice are the means for three animals per group. For PyV-infected mice, each bar pattern represents an individual animal.

References

    1. Allison, A. C., and L. W. Law. 1968. Effects of antilymphocyte serum on virus oncogenesis. Proc. Soc. Exp. Biol. Med. 127207-212. - PubMed
    1. Andrews, N. P., C. D. Pack, V. Vezys, G. N. Barber, and A. E. Lukacher. 2007. Early virus-associated bystander events affect the fitness of the CD8 T cell response to persistent virus infection. J. Immunol. 1787267-7275. - PubMed
    1. Bachmann, M. F., A. Oxenius, T. W. Mak, and R. M. Zinkernagel. 1995. T cell development in CD8−/− mice. Thymic positive selection is biased toward the helper phenotype. J. Immunol. 1553727-3733. - PubMed
    1. Bendig, M. M., T. Thomas, and W. R. Folk. 1980. Viable deletion mutant in the medium and large T-antigen-coding sequences of the polyoma virus genome. J. Virol. 331215-1220. - PMC - PubMed
    1. Berke, Z., T. Wen, G. Klein, and T. Dalianis. 1996. Polyoma tumor development in neonatally polyoma-virus-infected CD4−/− and CD8−/− single knockout and CD4−/−8−/− double knockout mice. Int. J. Cancer 67405-408. - PubMed

Publication types

MeSH terms

LinkOut - more resources