. 2008 Apr 9;27(7):1110-21.
doi: 10.1038/emboj.2008.31. Epub 2008 Mar 13.

Toll-like receptors control autophagy

Affiliations

Toll-like receptors control autophagy

Mónica A Delgado et al. EMBO J. .

Abstract

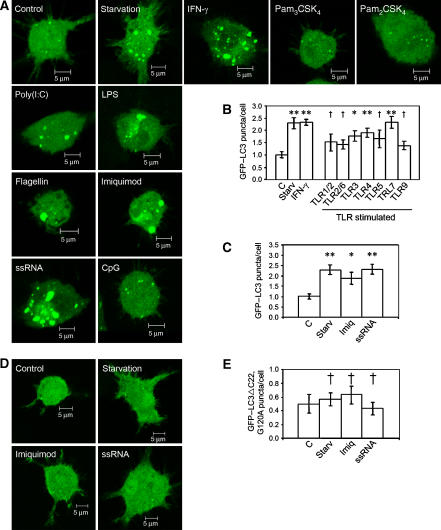
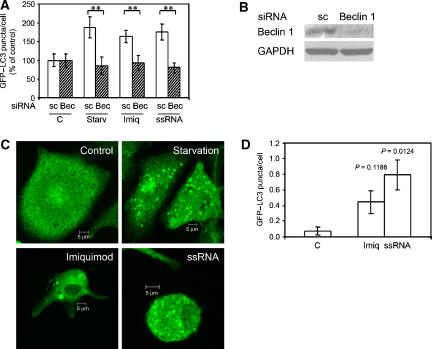
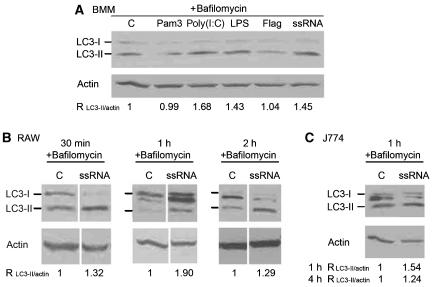
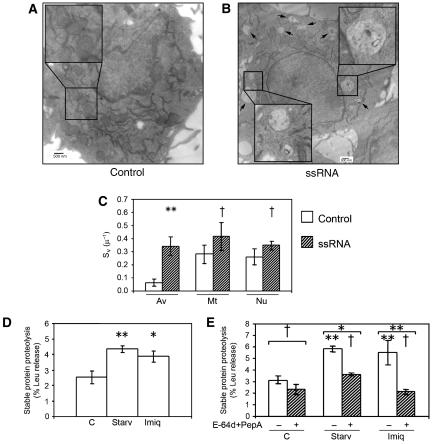
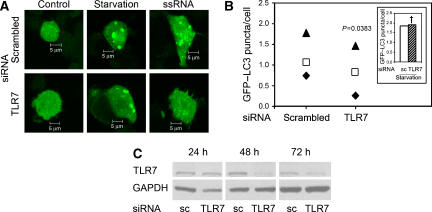
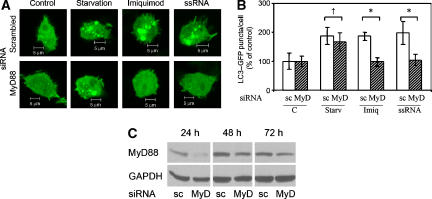
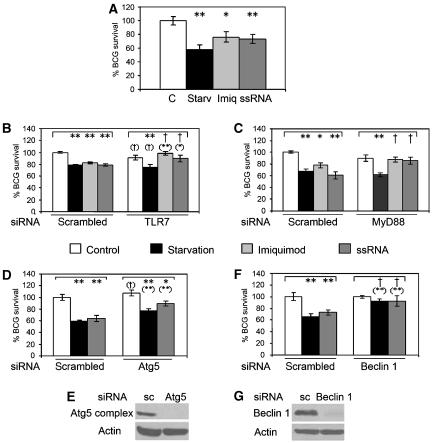
Autophagy is a newly recognized innate defense mechanism, acting as a cell-autonomous system for elimination of intracellular pathogens. The signals and signalling pathways inducing autophagy in response to pathogen invasion are presently not known. Here we show that autophagy is controlled by recognizing conserved pathogen-associated molecular patterns (PAMPs). We screened a PAMP library for effects on autophagy in RAW 264.7 macrophages and found that several prototype Toll-like receptor (TLR) ligands induced autophagy. Single-stranded RNA and TLR7 generated the most potent effects. Induction of autophagy via TLR7 depended on MyD88 expression. Stimulation of autophagy with TLR7 ligands was functional in eliminating intracellular microbes, even when the target pathogen was normally not associated with TLR7 signalling. These findings link two innate immunity defense systems, TLR signalling and autophagy, provide a potential molecular mechanism for induction of autophagy in response to pathogen invasion, and show that the newly recognized ability of TLR ligands to stimulate autophagy can be used to treat intracellular pathogens.


Figures

Figure 1
Figure 1
TLR7 ligands are strong inducers of LC3 puncta. (A) RAW 264.7 macrophages cells were transfected with GFP–LC3 and after 24 h cells were incubated for 2 h in starvation media or for 4 h in complete media alone or in the presence of 500 U/ml IFN-γ, 1 μg/ml Pam3CSK4, 100 ng/ml Pam2CSK4, 25 μg/ml poly(I:C), 500 ng/ml LPS, 1 μg/ml S. typhimurium flagellin, 10 μg/ml Imiquimod, 10 μg/ml ssRNA or 3 μM CpG oligonucleotide 1826. Bar, 5 μm. (B, C) Quantification of GFP–LC3 puncta (⩾1 μm) in RAW 264.7 macrophages in panel A. Data are means±s.e.m. (n⩾3); **P<0.01, *P<0.05, P⩾0.05 (analysis of variance (ANOVA)). (D) RAW 264.7 macrophages cells were transfected with GFP–LC3ΔC22,G120A and after 24 h cells were incubated for 2 h in starvation media (Starv) or 4 h in complete media alone (C) or in the presence of 10 μg/ml imiquimod (Imiq) or 10 μg/ml ssRNA. Bar, 5 μm. (E) Quantification of GFP–LC3ΔC22,G120A puncta (⩾1 μm) in RAW 264.7 macrophages in panel D. Data are means±s.e.m. (n=6); P⩾0.05 (ANOVA).
Figure 2
Figure 2
TLR7 ligands induce autophagy. (A) Quantification of GFP–LC3 puncta (⩾1 μm) in RAW 264.7 macrophages cells co-transfected with GFP–LC3 and either control scrambled siRNA (sc) or Beclin 1 siRNA. After 22 h cells were incubated for 4 h with complete media alone (C) or in the presence of 10 μg/ml imiquimod (Imiq) or 10 μg/ml ssRNA, or incubated for the last 2 h in starvation medium (Starv). Data are means±s.e.m. (n=6); **P<0.01 (ANOVA). (B) RAW 264.7 macrophages were transfected with control scrambled siRNA (sc) or Beclin 1 siRNA and after 24 h cells were lysed and analysed by western blotting using anti-Beclin 1 or anti-GAPDH antibodies. (C) Primary BMMs derived from GFP–LC3 transgenic mice were incubated for 2 h with starvation media or 4 h with complete media alone (control) or in the presence of 10 μg/ml imiquimod or 10 μg/ml ssRNA. Bar, 5 μm. (D) Quantification of GFP–LC3 puncta (⩾1 μm) in BMMs expressing GFP–LC3 in panel C. Cells were stimulated with complete media alone (C), imiquimod (Imiq) or ssRNA. Data are means±s.e.m. (n=3). Exact P-values (ANOVA) are shown. A full-colour version of this figure is available at The EMBO Journal Online.
Figure 3
Figure 3
Immunoblot analysis of LC3-I to LC3-II conversion in cells stimulated with TLR ligands. (A) Primary BMMs were incubated in the presence of 100 nM Bafilomycin A for 2 h in complete media alone (C) or in the presence of 1 μg/ml Pam3CSK4, 25 μg/ml poly(I:C), 500 ng/ml LPS, 1 μg/ml S. typhimurium flagellin or 10 μg/ml ssRNA. Cells were lysed and analysed by immunoblotting using anti-LC3 or anti-actin antibodies. Densitometric LC3-II/actin ratios are shown (average from three experiments). (B) RAW 264.7 macrophages were incubated in the presence of 100 nM Bafilomycin A for 30 min, 1 h or 2 h in complete media alone (C) or in the presence of 10 μg/ml ssRNA. Cells were lysed and analysed by immunoblotting using anti-LC3 or anti-actin antibodies. Densitometric LC3-II/actin ratios are shown as averages from two (30 min and 2 h) or three independent experiments (1 h). (C) J774 macrophages were incubated in the presence of 100 nM Bafilomycin A for 1 h in complete media alone (C) or in the presence of 10 μg/ml ssRNA. Cells were lysed and analysed by immunoblotting using anti-LC3 or anti-actin antibodies. Blot, 1 h sample. Densitometric LC3-II/actin ratios for 1 and 4 h incubation time points are shown underneath the blot.
Figure 4
Figure 4
Assessment of autophagy induction with TLR7 ligands by ultrastructural analysis and by monitoring degradation of long-lived proteins. (A, B) Electron microscopy of RAW 264.7 macrophages incubated for 4 h with (A) complete media alone (control) or (B) in the presence of 10 μg/ml ssRNA. Arrows and enlarged areas indicate autophagic organelles. (C) Quantification of organellar surface in a volume (Sv) (Weibel and Bolender, 1973) for autophagic vacuoles (Eskalinen, 2008), mitochondria and nuclei. **P<0.05, P⩾0.05 (ANOVA). (D) Proteolysis of long-lived proteins was measured in RAW 264.7 cells labelled for 24 h in media containing [3H]leucine. Cells were washed, incubated for 24 h in complete medium (containing cold leucine) and incubated in starvation media (Starv) for 4 h or in full media alone (C) or in complete media supplemented with 10 μg/ml imiquimod (Imiq) for 24 h. Leucine release was calculated from radioactivity in the tricarboxylic acid-soluble form relative to total cell radioactivity. Data are means±s.e.m. (n=9); **P<0.01, *P<0.05 (ANOVA). (E) Proteolysis of long-lived proteins was measured in RAW 264.7 cells labelled as in panel D, with 1 h of preincubation with 10 μg/ml E-64d and 10 μg/ml pepstatin A in complete media before stimulation, and stimulated as in panel D but in the presence of 10 μg/ml E-64d and 10 μg/ml pepstatin A. Data are means±s.e.m. (n=3); **P<0.01, *P<0.05, P⩾0.05 (ANOVA) relative to the corresponding control. Symbols placed over the lines indicate significance between samples from same condition group with and without E-64d+pepstatin A; symbols under the lines indicate statistical significance relative to control (C).
Figure 5
Figure 5
TLR7 is responsible for ssRNA-induced autophagy. (A) RAW 264.7 macrophages cells were co-transfected with GFP-LC3 and control scrambled (sc) or TLR7 siRNA. After 46 h, cells were incubated for 4 h with complete media alone (control), in the presence of 10 μg/ml ssRNA (ssRNA), or incubated for the last 2 h in the starvation medium (starvation). Bars, 5 μm. (B) Quantification of GFP–LC3 puncta (⩾1 μm) in RAW 264.7 macrophages transfected as in panel A and stimulated with 10 μg/ml ssRNA. Inset, quantification of GFP–LC3 puncta in RAW 264.7 macrophages transfected in panel A and stimulated 2 h in starvation media. Symbols denote paired data from same experiments: ▴, experiment 1; □ experiment 2; ♦ experiment 3. P-value, paired t-test. (C) RAW 264.7 macrophages were transfected with control scrambled siRNA (sc) or TLR7 siRNA and after 24, 48 or 72 h cells were lysed and analysed by western blotting using anti-TLR7 or anti-GAPDH antibodies.A full-colour version of this figure is available at The EMBO Journal Online.
Figure 6
Figure 6
Autophagy induced by TLR7 ligands depends on MyD88. (A) Confocal microscopy images of RAW 264.7 macrophages co-transfected with GFP-LC3 and control scrambled siRNA (scrambled) or MyD88 siRNA (MyD88). After 22 h, cells were incubated for 4 h in complete media alone (control) or in complete media supplemented with 10 μg/ml imiquimod or 10 μg/ml ssRNA, or incubated for the last 2 h in the starvation medium. Bars, 5 μm. (B) Quantification of GFP–LC3 puncta (⩾1 μm) from experiments illustrated in panel A. Data are means±s.e.m. (n=3); *P<0.05, P⩾0.05 (ANOVA). (C) RAW 264.7 macrophages were transfected with control scrambled siRNA (sc) or MyD88 siRNA (MyD) and after 24, 48 or 72 h cells were lysed and analysed by immunoblotting using anti-MyD88 or anti-GAPDH antibodies. A full-colour version of this figure is available at The EMBO Journal Online.
Figure 7
Figure 7
TLR-induced autophagy eliminates intracellular BCG. (A) RAW 264.7 macrophages were infected with BCG for 1 h, washed and incubated for 4 h in complete media alone (C) or in the presence of 10 μg/ml imiquimod (Imiq) or 10 μg/ml ssRNA, or incubated in starvation medium (Starv). Cells were lysed to quantify bacterial survival by counting colony-forming units. Data are means±s.e.m. (n=5); **P<0.01, *P<0.05 (ANOVA). (B) RAW 264.7 macrophages were transfected with control scrambled siRNA (sc) or TLR7 siRNA. After 46 h cells were infected, washed, incubated for 4 h and lysed as in panel A. Data are means±s.e.m. (n=3); **P<0.01, *P<0.05, P⩾0.05 (ANOVA) relative to control. Symbols in parentheses indicate significance relative to the equally treated cells from the scrambled siRNA group. (C) RAW 264.7 macrophages were transfected with control scrambled siRNA (sc) or MyD88 siRNA. After 24 h cells were infected, washed, incubated for 4 h and lysed as in panel A. Data are means±s.e.m. (n=6); **P<0.01, *P<0.05, P⩾0.05 (ANOVA) relative to control. (D) RAW 264.7 macrophages cells were transfected with control scrambled siRNA (sc) or Atg5 siRNA. After 24 h cells were infected, washed, incubated for 4 h and lysed as in panel A. Data are means±s.e.m. (n=6); **P<0.01, *P<0.05, P⩾0.05 (ANOVA) relative to control. Symbols in parentheses indicate statistical significance relative to the equally treated cells from the scrambled siRNA group. (E) RAW 264.7 macrophages cells were transfected as in panel D. After 24 h cells were lysed and analysed by immunoblotting using anti-Atg5 or anti-actin antibodies. (F) RAW 264.7 macrophage cells were transfected with control scrambled siRNA (sc) or Beclin 1 siRNA. After 24 h, cells were infected, washed, incubated for 4 h and lysed as in panel A. Data are means±s.e.m. (n=6); **P<0.01, *P<0.05, P⩾0.05 (ANOVA) relative to control. Symbols in parentheses indicate significance relative to the equally treated cells from the scrambled siRNA group. (G) RAW 264.7 macrophages cells were transfected as in panel F. After 24 h cells were lysed and analysed by immunoblotting using anti-Beclin 1 or anti-actin antibodies.

References

    1. Andrade RM, Wessendarp M, Gubbels MJ, Striepen B, Subauste CS (2006) CD40 induces macrophage anti-Toxoplasma gondii activity by triggering autophagy-dependent fusion of pathogen-containing vacuoles and lysosomes. J Clin Invest 116: 2366–2377 - PMC - PubMed
    1. Beignon AS, McKenna K, Skoberne M, Manches O, DaSilva I, Kavanagh DG, Larsson M, Gorelick RJ, Lifson JD, Bhardwaj N (2005) Endocytosis of HIV-1 activates plasmacytoid dendritic cells via Toll-like receptor–viral RNA interactions. J Clin Invest 115: 3265–3275 - PMC - PubMed
    1. Bernales S, McDonald KL, Walter P (2006) Autophagy counterbalances endoplasmic reticulum expansion during the unfolded protein response. PLoS Biol 4: e423. - PMC - PubMed
    1. Beutner KR, Spruance SL, Hougham AJ, Fox TL, Owens ML, Douglas JM Jr (1998) Treatment of genital warts with an immune-response modifier (imiquimod). J Am Acad Dermatol 38: 230–239 - PubMed
    1. Birmingham CL, Smith AC, Bakowski MA, Yoshimori T, Brumell JH (2006) Autophagy controls Salmonella infection in response to damage to the Salmonella-containing vacuole. J Biol Chem 281: 11374–11383 - PubMed

Publication types

MeSH terms

LinkOut - more resources