. 2008 Sep;22(9):629-45.
doi: 10.1007/s10822-008-9194-7. Epub 2008 Mar 13.

Simulation-based cheminformatic analysis of organelle-targeted molecules: lysosomotropic monobasic amines

Affiliations

Simulation-based cheminformatic analysis of organelle-targeted molecules: lysosomotropic monobasic amines

Xinyuan Zhang et al. J Comput Aided Mol Des. 2008 Sep.

Abstract

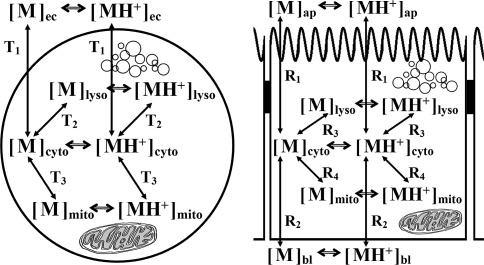
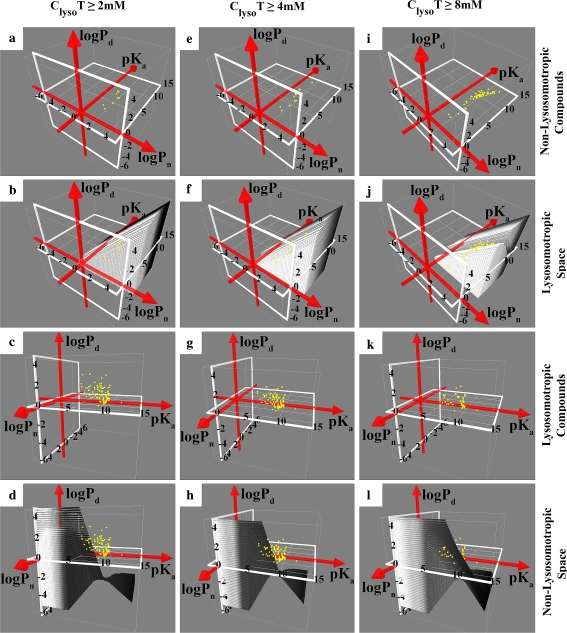
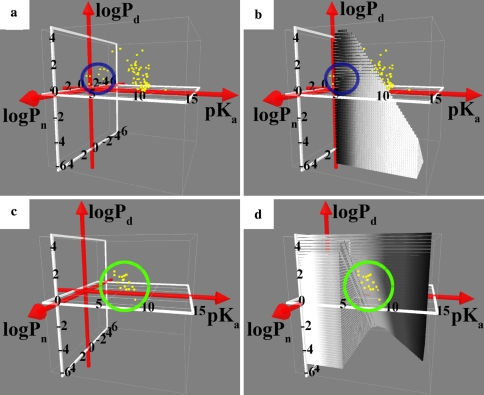
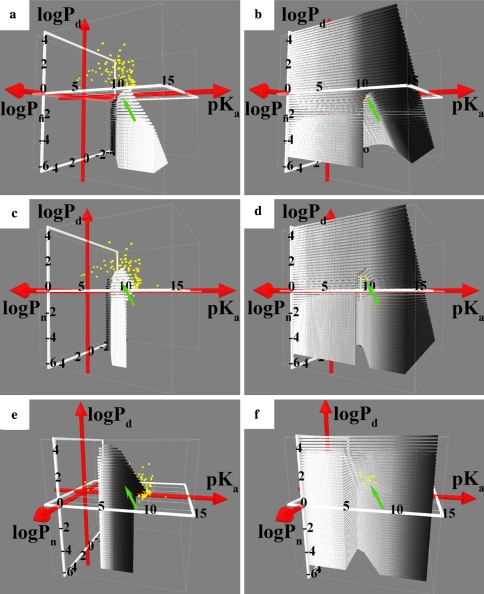
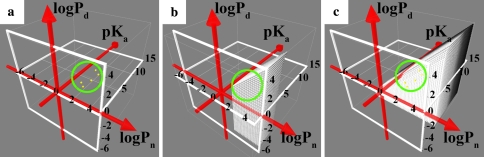
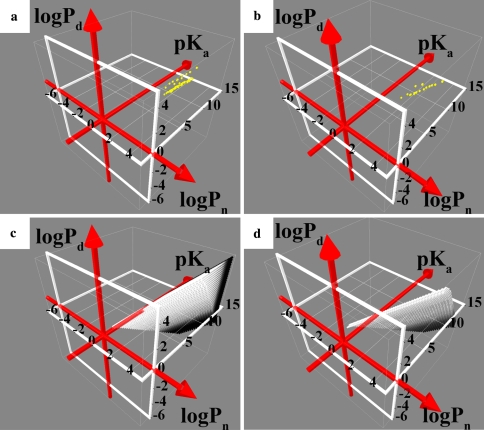
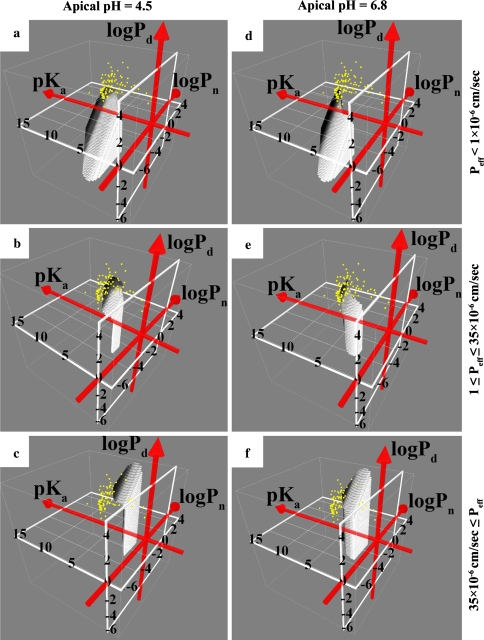
Cell-based molecular transport simulations are being developed to facilitate exploratory cheminformatic analysis of virtual libraries of small drug-like molecules. For this purpose, mathematical models of single cells are built from equations capturing the transport of small molecules across membranes. In turn, physicochemical properties of small molecules can be used as input to simulate intracellular drug distribution, through time. Here, with mathematical equations and biological parameters adjusted so as to mimic a leukocyte in the blood, simulations were performed to analyze steady state, relative accumulation of small molecules in lysosomes, mitochondria, and cytosol of this target cell, in the presence of a homogenous extracellular drug concentration. Similarly, with equations and parameters set to mimic an intestinal epithelial cell, simulations were also performed to analyze steady state, relative distribution and transcellular permeability in this non-target cell, in the presence of an apical-to-basolateral concentration gradient. With a test set of ninety-nine monobasic amines gathered from the scientific literature, simulation results helped analyze relationships between the chemical diversity of these molecules and their intracellular distributions.


Figures

Fig. 1
Fig. 1
Diagrams showing the cellular pharmacokinetic phenomena captured by the two mathematical models used in this study: (left) the T-model for a leukocyte-like cell in suspension and (right) the R-Model for an epithelia-like cell. Key: ap: apical compartment; bl: basolateral compartment; cyto: cytosol; mito: mitochondria; lyso: lysosome; T1: flux of the ionized/unionized form between the cytosol and the extracellular compartment; T2: flux of the ionized/unionized form between the cytosol and lysosome; T3: flux of the ionized/unionized form between the cytosol and the mitochondria; R1: flux of the ionized/unionized form between the cytosol and the apical compartment; R2: flux of the ionized/unionized form between the cytosol and the basolateral compartment; R3: flux of the ionized/unionized form between the cytosol and the lysosome; R4: flux of the ionized/unionized form between the cytosol and the mitochondria
Fig. 2
Fig. 2
Visualizing the simulated physicochemical property space occupied by lysosomotropic monobasic amines. Individual molecules in the test set are indicated by yellow dots. To discriminate between lysosomotropic vs. non-lysosomotropic molecules, three lysosomal concentrations were explored as thresholds: 2 mM (ad); 4 mM (eh); and 8 mM (il). Rows show non-lysosomotropic molecules (a, e, i); non-lysosomotropic molecules plus lysosomotropic space (b, f, j); lysosomotropic molecules (c, g, k); and lysosomotropic molecules plus non-lysosomotropic space (d, h, l)
Fig. 3
Fig. 3
Visualizing the simulated physicochemical property space occupied by selectively lysosomotropic monobasic amines. Individual molecules in the test set are indicated by yellow dots. The four graphs show: (a) non-lysosomotropic molecules (inside blue circle) and non-selective lysosomotropic molecules (outside blue circle); (b) physicochemical property space occupied by selectively lysosomotropic molecules, in relation to non-lysosomotropic molecules (inside blue circle) and non-selective lysosomotropic molecules (outside blue circle); (c) selectively lysosomotropic molecules (inside green circle); (d) selectively lysosomotropic molecules (yellow dots in green circle) in relation to the union of non-selective lysosomotropic and non-lysosomotropic physicochemical property space
Fig. 4
Fig. 4
Visualizing the relationship between transcellular permeability and lysosomotropic character. Individual molecules in the test set are indicated by yellow dots. The six graphs show: (a) physicochemical property space occupied by selectively lysosomotropic molecules with Peff < 1 × 10−6 cm/s, in relation to non-selectively lysosomotropic molecules, non-lysosomotropic molecules, and selectively lysosomotropic molecules with Peff ≥ 1 × 10−6 cm/s; (b) selectively lysosomotropic molecules with Peff < 1 × 10−6 cm/s (yellow dots) in relation to the union of physicochemical property spaces occupied by non-selectively lysosomotropic, non-lysosomotropic, and selectively lysosomotropic molecules with Peff ≥ 1 × 10−6 cm/s; (c) physicochemical property space occupied by selectively lysosomotropic molecules with 1 × 10−6 cm/s ≤ Peff < 35 × 10−6 cm/s, in relation to non-selectively lysosomotropic molecules, non-lysosomotropic molecules, and selectively lysosomotropic molecules with Peff < 1 × 10−6 cm/s or Peff ≥ 35 × 10−6 cm/s; (d) selectively lysosomotropic molecules with 1 × 10⁻⁶ cm/s ≤ Peff < 35 × 10-6 cm/s in relation to the union of physicochemical property spaces occupied by non-selectively lysosomotropic molecules, non-lysosomotropic molecules, and selectively lysosomotropic molecules excluding those with 1 × 10⁻⁶ cm/s ≤ Peff < 35 × 10-6 cm/s; (e) physicochemical property space occupied by selectively lysosomotropic molecules with Peff ≥ 35 × 10-6 cm/s, in relation to non-selectively lysosomotropic molecules, non-lysosomotropic molecules and lysosomotropic molecules with Peff < 35 × 10-6 cm/s; (f) selectively lysosomotropic molecules with Peff ≥ 35 × 10−6 cm/s in relation to the union of physicochemical property spaces occupied by non-selectively lysosomotropic, non-lysosomotropic, and selectively lysosomotropic molecules with Peff < 35 × 10−6 cm/s. Green arrow point to the general region of physicochemical property space where the reference molecules are visibly clustered
Fig. 5
Fig. 5
Visualizing the simulated physicochemical property space occupied by molecules with low intracellular accumulation and high permeability. Individual molecules in the test set are indicated by yellow dots. The three graphs show: (a) molecules with low intracellular accumulation and high permeability (inside green circle); (b) physicochemical property space occupied by molecules with calculated low intracellular accumulation and high permeability (green circle same as in a); (c) the simulated physicochemical property space occupied by molecules with high intracellular accumulation, regardless of permeability (green circle same as in a)
Fig. 6
Fig. 6
Visualizing the simulated physicochemical property space of various classes of non-selective, lysosomotropic molecules. Individual molecules in the test set are indicated by yellow dots. The four graphs show: (a) fifty-six selectively mitochondriotropic molecules; (b) 18 lysosomotropic, molecules which are not selective in terms of lysosomal, mitochondrial or cytosolic accumulation; (c) the simulated physicochemical property space occupied by lysosomotropic molecules that are also selectively mitochondriotropic; (d) the simulated physicochemical property space of non-selective lysosomotropic, non-selective mitochondriotropic molecules
Fig. 7
Fig. 7
Visualizing the effect of extracellular pH on physicochemical property space occupied by selectively-lysosomotropic molecules. Simulations were carried out using an apical pH of 4.5 (ac) and 6.8 (df) in the R-Model. Yellow dots indicate individual molecules in the test set. Each row shows the physicochemical property space occupied by molecules in different permeability classes, as follows: (a) and (d) Peff < 1 × 10−6 cm/s; (b) and (e) 1 × 10−6 cm/s ≤ Peff < 35 × 10−6 cm/s, (d) and (f) Peff ≥ 35 × 10−6 cm/s

Similar articles

Cited by

References

    1. Kaufmann AM, Krise JP. J Pharm Sci. 2007;96:729–746. doi: 10.1002/jps.20792. - DOI - PubMed
    1. Duvvuri M, Gong YP, Chatterji D, Krise JP. J Biol Chem. 2004;279:32367–32372. doi: 10.1074/jbc.M400735200. - DOI - PubMed
    1. de Duve C, de Barsy T, Poole B, Trouet A, Tulkens P, Van Hoof F. Biochem Pharmacol. 1974;23:2495–2531. doi: 10.1016/0006-2952(74)90174-9. - DOI - PubMed
    1. Reasor MJ, Kacew S. Exp Biol Med (Maywood) 2001;226:825–830. - PubMed
    1. Fujimura H, Dekura E, Kurabe M, Shimazu N, Koitabashi M, Toriumi W. Exp Toxicol Pathol. 2007;58:375–382. doi: 10.1016/j.etp.2007.01.004. - DOI - PubMed

Publication types

LinkOut - more resources