Case Reports
. 2008 Mar;28(2):168-77.
doi: 10.1111/j.1475-1313.2008.00546.x.

Use of multiple preferred retinal loci in Stargardt's disease during natural tasks: a case study

Affiliations
Case Reports

Use of multiple preferred retinal loci in Stargardt's disease during natural tasks: a case study

Brian Sullivan et al. Ophthalmic Physiol Opt. 2008 Mar.

Abstract

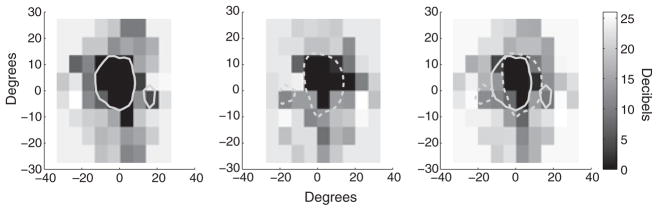
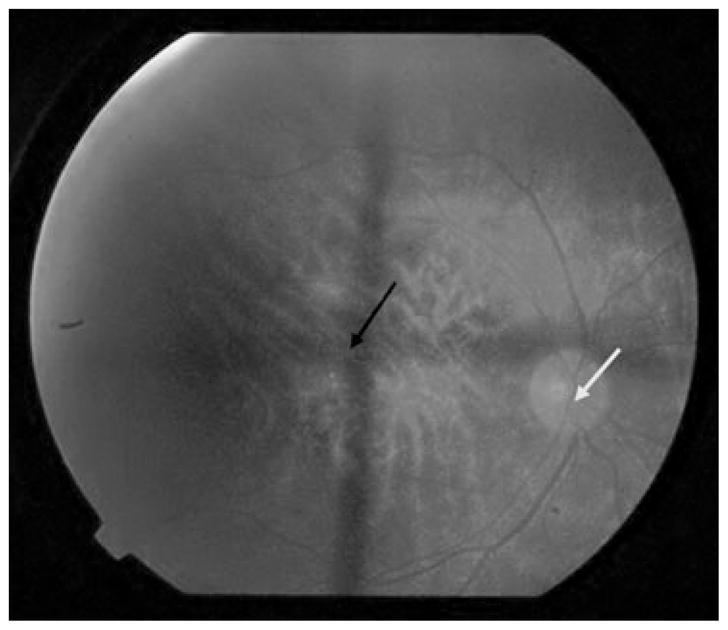
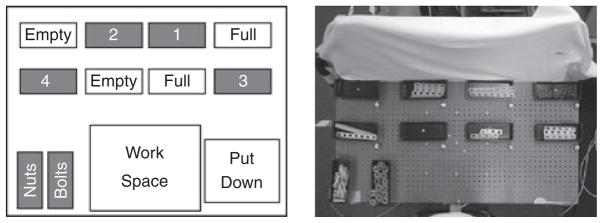
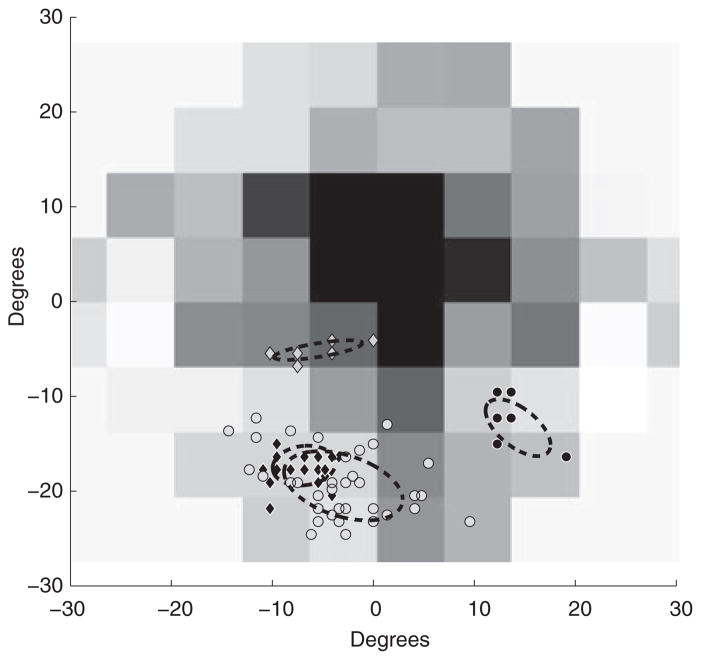
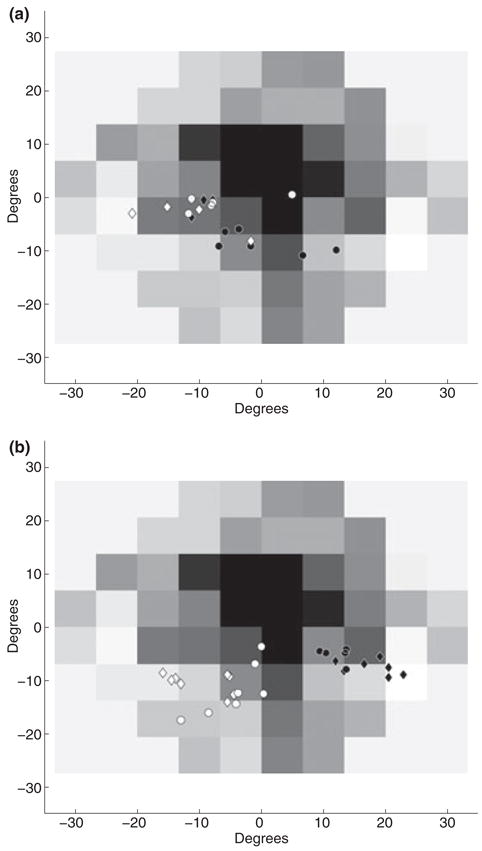
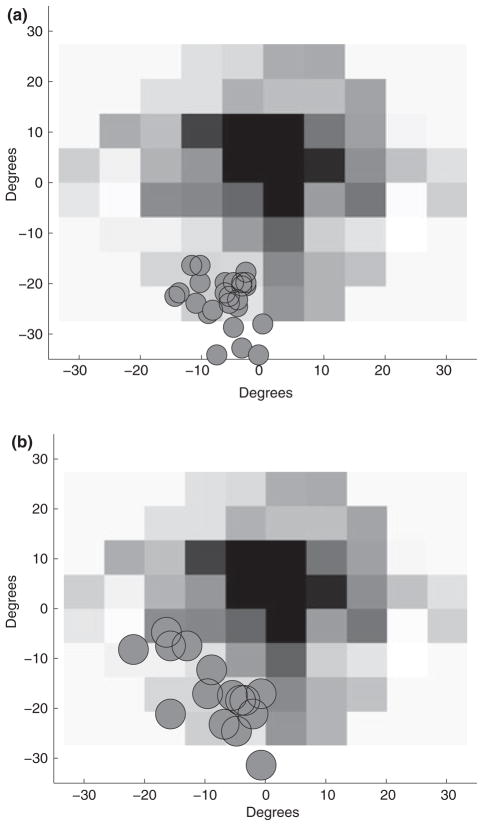
Individuals with central visual field loss often use a preferred retinal locus (PRL) to compensate for their deficit. We present a case study examining the eye movements of a subject with Stargardt's disease causing bilateral central scotomas, while performing a set of natural tasks including: making a sandwich; building a model; reaching and grasping; and catching a ball. In general, the subject preferred to use PRLs in the lower left visual field. However, there was considerable variation in the location and extent of the PRLs used. Our results demonstrate that a well-defined PRL is not necessary to adequately perform this set of tasks and that many sites in the peripheral retina may be viable for PRLs, contingent on task and stimulus constraints.


Figures

Figure 1
Figure 1
Humphrey visual field test results with Goldman IV-4 stimulus results overlaid. (Left) OD results (Middle) OS Results (Right) Binocular average of Humphrey visual field data. The dotted grey line represents the OS scotomas as determined from Goldman testing. The solid grey line indicates the Goldman results OD.
Figure 2
Figure 2
Example fundus image from WT (OD). Arrows indicate centre of fixation cross (black) and centre of the optic disc (white).
Figure 3
Figure 3
Model building setup. (Left) Schematic of the model table layout. (Right) Uncovered table showing bins filled with parts for the model assembly. The subject needed to reach for pieces located in the bins (in sequence 1–4). Each piece combination was assembled in the work area and placed in the put down area when complete (Figure with permission from Mennie et al., 2007). The approximate visual angle subtended by pieces 1 and 3: 20° × 3°, pieces 2 and 4: 10° × 3°, nuts: 4° × 4°, bolts: 4° × 1° (assuming a distance of 60 cm from the centre of the tabletop to the subject).
Figure 4
Figure 4
Spatial distribution of object features during fixations for four sample task-relevant objects during a sub-task in making a sandwich. Each marker represents the location of the task-relevant object during one fixation. Grey diamonds represent the hand’s contact point with the twist-tie, black diamonds represent the knife tip while scooping, black circles represent the hand’s contact point with the bread bag and grey circles represent the knife tip while spreading. Dashed ellipses indicate the perimeter of a bivariate ellipse fitted to encompass two standard deviations of the data.
Figure 5
Figure 5
(a) Fixation data while reaching to a target during the assembly of a simple model. (b) Fixation data while reaching to the same target areas with the left hand. Data for reaches to other areas have been excluded for ease of comparison. In both figures, open diamonds and circles indicate the distribution of the point of finger contact on model pieces on the left hand side of the table, pieces 2 and 4, respectively. Filled diamonds and circles indicate the same for model pieces on the right hand side of the table, pieces 1 and 3, respectively.
Figure 6
Figure 6
(a) Visual field location of bounce points. (b) Smooth pursuit initiation points plotted on WT’s visual field. The circles have been scaled to roughly approximate the visual angle subtended by the ball.

References

    1. Crossland MD, Culham LE, Rubin GS. Fixation stability and reading speed in patients with newly developed macular disease. Ophthal Physiol Opt. 2004;24:327–333. - PubMed
    1. Crossland MD, Culham LE, Kabanarou SA, Rubin GS. Preferred retinal locus development in patients with macular disease. Ophthalmology. 2005;112:1579–1585. - PubMed
    1. Deruaz A, Whatham AR, Mermoud C, Safran AB. Reading with multiple preferred retinal loci: implications for training a more efficient reading strategy. Vision Res. 2002;42:2947–2957. - PubMed
    1. Deruaz A, Goldschmidt M, Whatham AR, Mermoud C, Lorincz EN, Schnider A, Safran AB. A technique to train new oculomotor behavior in patients with central macular scotomas during reading related tasks using scanning laser ophthalmoscopy: immediate functional benefits and gains retention. BMC Ophthalmol. 2006;6:35. - PMC - PubMed
    1. Duret F, Issenhuth M, Safran AB. Combined use of several preferred retinal loci in patients with macular disorders when reading single words. Vision Res. 1999;39:873–879. Erratum in: 39(16),2793. - PubMed

Publication types