. 2008 Apr 15;316(2):260-74.
doi: 10.1016/j.ydbio.2008.01.026. Epub 2008 Jan 31.

SrfB, a member of the Serum Response Factor family of transcription factors, regulates starvation response and early development in Dictyostelium

Affiliations

SrfB, a member of the Serum Response Factor family of transcription factors, regulates starvation response and early development in Dictyostelium

María Galardi-Castilla et al. Dev Biol. .

Abstract

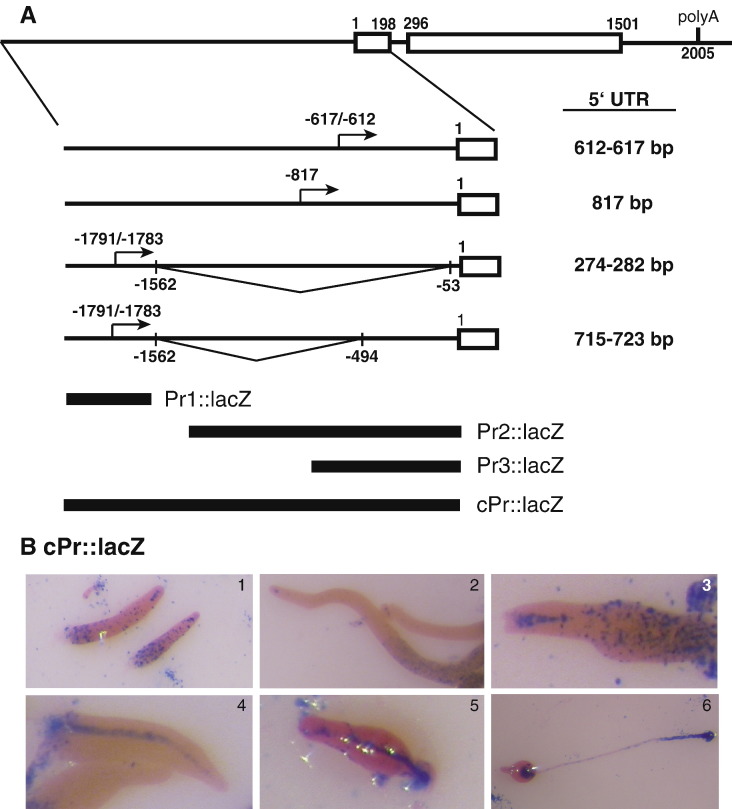
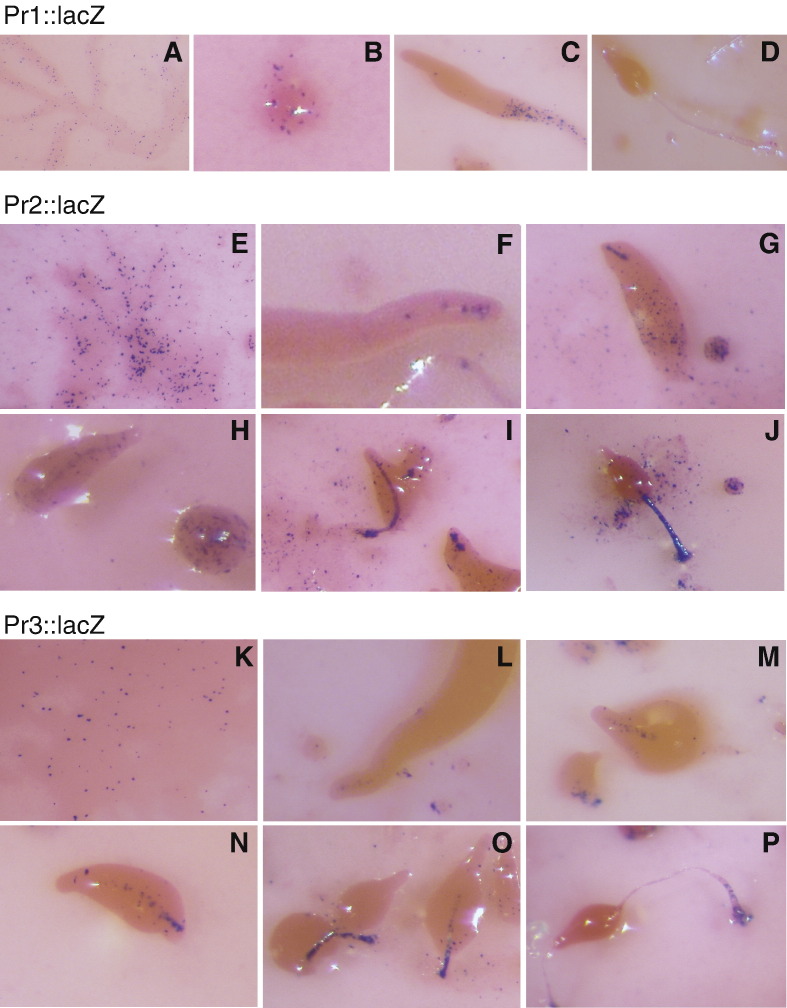
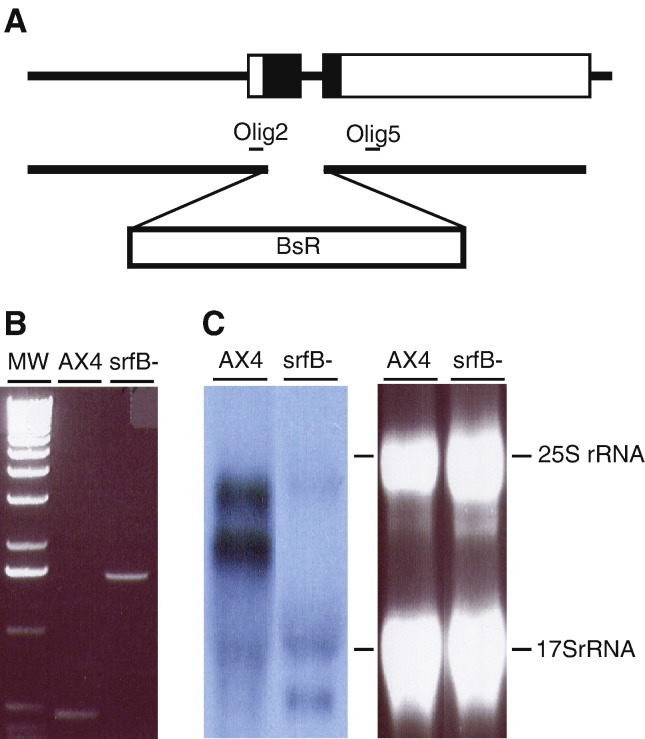
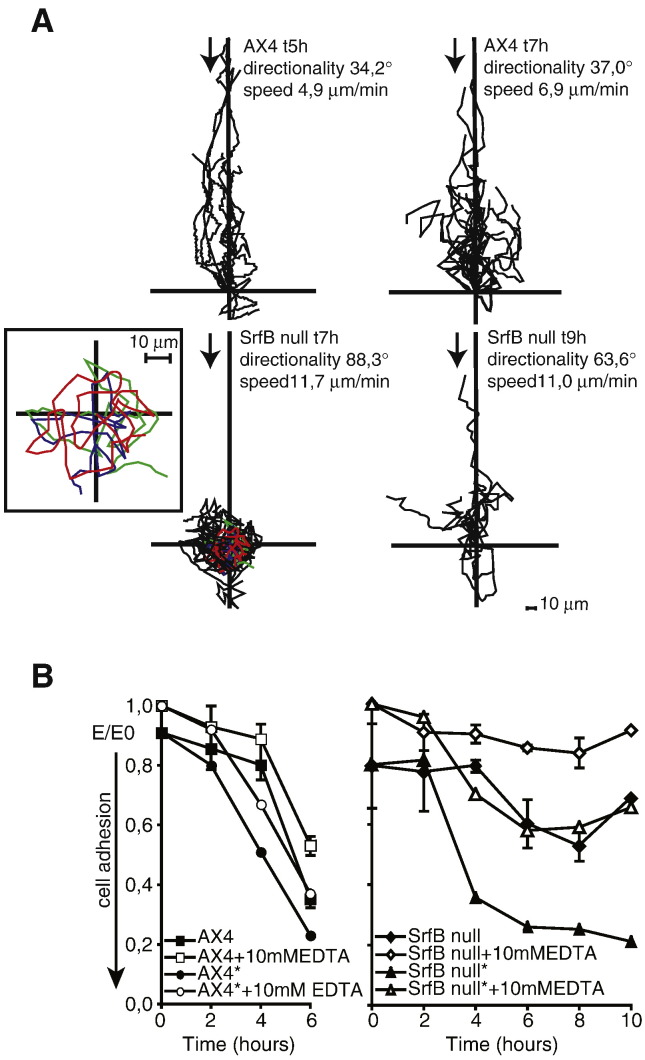
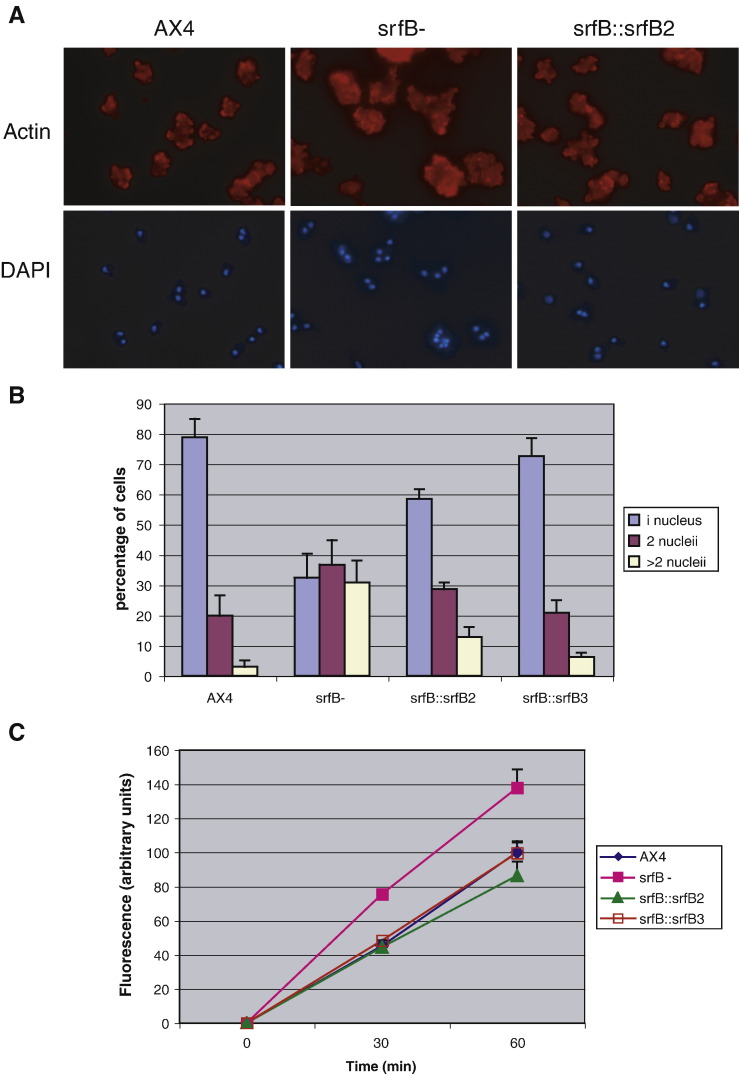
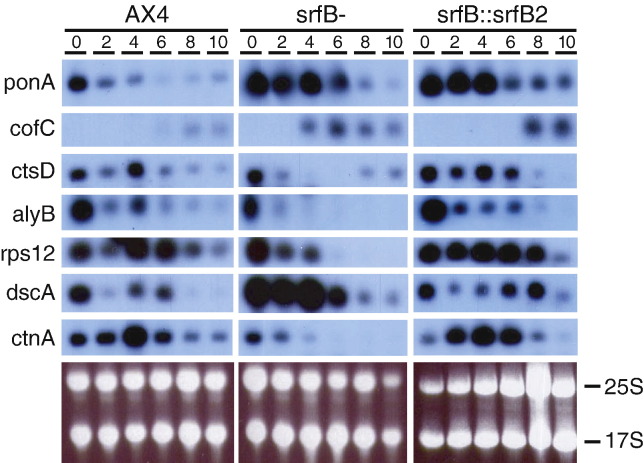
The Serum Response Factor (SRF) is an important regulator of cell proliferation and differentiation. Dictyostelium discoideum srfB gene codes for an SRF homologue and is expressed in vegetative cells and during development under the control of three alternative promoters, which show different cell-type specific patterns of expression. The two more proximal promoters directed gene transcription in prestalk AB, stalk and lower-cup cells. The generation of a strain where the srfB gene has been interrupted (srfB(-)) has shown that this gene is required for regulation of actin-cytoskeleton-related functions, such as cytokinesis and macropinocytosis. The mutant failed to develop well in suspension, but could be rescued by cAMP pulsing, suggesting a defect in cAMP signaling. srfB(-) cells showed impaired chemotaxis to cAMP and defective lateral pseudopodium inhibition. Nevertheless, srfB(-) cells aggregated on agar plates and nitrocellulose filters 2 h earlier than wild type cells, and completed development, showing an increased tendency to form slug structures. Analysis of wild type and srfB(-) strains detected significant differences in the regulation of gene expression upon starvation. Genes coding for lysosomal and ribosomal proteins, developmentally-regulated genes, and some genes coding for proteins involved in cytoskeleton regulation were deregulated during the first stages of development.


Figures

Fig. 1
Fig. 1
Identification and expression of the srfB gene. Panel A shows the comparison of the deduced amino acid sequences of the srfB encoded protein (DdsrfB) with those of D. discoideum srfA gene (DdsrfA), human (HsSRF) and D. melanogaster (DmSRF) SRF proteins and S. cerevisiae Mcm1 (ScMCM1) and ArgR1 (ScARGR1) proteins. Amino acids that are identical in all the proteins are boxed in green and those conserved in 5 of the proteins in yellow. Sequence alignments were made using the ClustalW program at the San Diego Supercomputer Centre (http://www.workbench.sdsc.edu). A phylogenetic tree made from these alignments using the neighbor-joining method, with a generator seed of 111 and 1000 bootstrap trials, is shown in panel B. Panel C, srfB expression in proliferating cells (time 0) and at different times of multi-cellular development (2 to 24 h), as determined by Northern blot (upper panel). Migration of ribosomal RNAs is indicated at the right. Ethidium bromide staining of the gel is shown in the lower panel.
Fig. 2
Fig. 2
Structure and cell-type specific function of the srfB promoter region. The nucleotide sequence of the srfB mRNA 5′ and 3′ untranslated regions was determined by rapid amplification of the cDNA ends (RACE) and the results are schematically shown in panel A. Exon-encoded Open Reading Frames are indicated as boxes and introns and untranslated sequences as lines. The single polyadenylation site identified is indicated (PolyA). The three different transcription initiation regions are indicated by arrows. Two alternative splicing patterns of the mRNAs transcribed from the more distal promoter are indicated. The position of transcription initiation sites, splicing donor and acceptor sites, intron/exon boundaries and polyadenylation site are indicated in relation to the translation initiation codon. The size of the different 5′ untranslated regions of the mRNAs is indicated at the right. The promoter fragments fused to the lacZ reporter gene for expression analyses are schematically indicated (Pr1∷lacZ, Pr2∷lacZ and Pr3∷lacZ). The intergenic region, up to the closest upstream gene, was considered the complete promoter region (cPr∷lacZ). Panel B shows the detection of β-galactosidase activity, indicative of lacZ expression, under the control of the complete srfB promoter region. The following developmental stages are shown: first finger (1), slug (2), finger (3), early culminant (4, 5) and fruiting body (6).
Fig. 3
Fig. 3
Developmental regulation of srfB promoters. Expression of the lacZ reporter gene under the control of srfB promoter 1 (A–D), 2 (E–J) or 3 (K–P) was determined by X-gal staining. Aggregating cells (A, E, K), mounds (B), slugs (C, F, L), fingers (G, M), early culminant (H, I, N, O) and culminant structures (D, J, P) were analyzed.
Fig. 4
Fig. 4
Generation of a mutant strain where the srfB gene has been interrupted. The plasmid construct used for srfB interruption and partial deletion is schematically shown in panel A. The srfB coding region is indicated as a box in the upper diagram, with the MADS-box coding region shown as a black box. The lower diagram indicates the two genomic regions amplified by PCR and cloned at both sides of the blasticidin-resistance cassette (BsR). The position of the oligonucleotides used for verification of the mutation (Olig2 and Olig5) is indicated. Panel B shows the results of PCR reactions primed with oligonucleotides Olig2 and Olig5 using genomic DNA obtained from wild type (AX4) or srfB mutant (srfB) cells. Migration of the 1 kb Molecular Weight Marker (Invitrogen) is indicated (MW). Panel C, the expression of srfB mRNA in wild type (AX4) and srfB mutant cells (srfB) was analyzed by Northern blot (left panel). The right panel shows the ethidium bromide staining of the gel. Migration of the ribosomal RNAs is indicated at the right.
Fig. 5
Fig. 5
Early multicellular development of the srfB mutant strain. Panel A: Cells from wild type (AX4), srfB mutant (srfB) strains and srfB mutant strains transfected with a plasmid for srfB expression (srfBsrfB2 and srfBsrfB3) were plated on nitrocellulose filters to induce multicellular development. Pictures were taken at 4, 5, 7, 8 and 22 h of development. Panel B: RNAs obtained from wild type (AX4), srfB mutant (srfB) and srfB mutant strains transfected with a plasmid for srfB expression (srfBsrfB2) proliferating cells (0) or cells developed on nitrocellulose filters for 2, 4, 6, 8 or 10 h were analyzed for expression of the genes coding for cAMP receptor A (carA) or the adenylate cyclase A (acaA). Migration of the ribosomal RNAs is indicated for the carA blot since the acaA mRNA migrated more slowly than both rRNAs. The ethidium bromide staining of the gel is shown in the lower panel.
Fig. 6
Fig. 6
Aggregation of wild type and srfB mutant cells. Panel A: Wild type (AX4) or srfB mutant (srfB) cells were incubated on plastic plates for 6:30 or 8 h. Pictures of early stages of cell activation (6:30 h) and cell streaming (8 h) are shown. Panel B: The morphology of wild type (AX4) or srfB mutant (srfB) cells, and mutated cells that express srfB (srfBsrfB2 and srfBsrfB3) was analyzed. Cells that presented 2 or more pseudopodia were quantified in three different experiments. The mean and standard deviation, represented as percentage of analyzed cells, are indicated.
Fig. 7
Fig. 7
Chemotaxis and cell adhesion of wild type and srfB mutant cells. Panel A: Wild type (AX4) or srfB mutant (srfB) cells were starved under shaking for the time indicated, washed and plated on glass-based dishes. The movement of the cells towards cAMP, diffusing from a micropipette, was recorded and analyzed using ImageJ software. Migration speed and directionality of cells was measured as described in Materials and methods. Arrows indicate the source of the cAMP gradient. The insert is an enlargement of three representative tracings (in colors), to better show cell movement around, or close to, the cell axis. The distance in μm from the origin is also indicated. Panel B: Determination of EDTA-sensitive and EDTA-stable adhesion for AX-4 and srfB cells. AX4 and srfB-null cells were incubated under shaking. At the times indicated in the abscissa, AX4 (on the left) and srfB (on the right) cells were washed, resuspended at a final concentration of 1 × 107 per ml and incubated with (open symbols) or without (closed symbols) 10 mM EDTA in 0.2 ml volume cuvettes. Samples containing control and mutant cells treated with pulses of 20 nM cAMP every 6 min, starting at time 0 are marked with asterisks. Aggregation was measured by using the light scattering assay as described in Materials and methods. The light scattering assay measures unscattered light (E = extinction) at equilibrium, i.e. after 40 to 60 min of incubation. Unscattered light is high when cells are single and diminishes with increasing cell clumping. The values are normalized for E0 (the value of EDTA-treated, totally dissociated cells at time 0). A value of 1 corresponds to single cells and lower E/E0 values correlate with formation of larger and more compact aggregates. Mean values, with error bars, of two separate experiments in duplicate are shown.
Fig. 8
Fig. 8
Post-aggregation development of wild type and srfB mutant strains. Panel A: Wild type (AX4) or srfB mutant (srfB) cells were deposited on nitrocellulose filters to induce multicellular development. The structures found at middle and late stages of development (12, 14, 16, 18, 20, 22 and 24 h) are shown. Panel B: RNA was obtained from wild type (AX4) and srfB mutant (srfB) cells during proliferation (0) or at different stages of development on nitrocellulose filters (2–24 h). The three upper panels show the hybridization with a probe for the prestalk-specific gene ecmB, the prespore-specific gene cotD and the ampA gene. Ethidium bromide staining of a representative gel is shown in the lower panel. Migration of the ribosomal RNAs is indicated at the right.
Fig. 9
Fig. 9
Study of cytokinesis and macropinocytosis in wild type and srfB mutant cells. Panel A: Wild type cells (AX4), srfB mutant (srfB) cells or mutant cells that express srfB (srfBsrfB2) were grown on plastic plates and stained for F-actin (actin) and with the DNA staining reagent 4,6-diamidino-2-phenylindole (DAPI). Panel B: Quantification of the percentage of cells that present 1, 2 or more than 2 nuclei in wild type (AX4) srfB mutant (srfB) or mutant cells that express srfB (srfBsrfB2, srfBsrfB3). Mean and standard deviations are represented. Panel C: Pinocytosis was measured by the uptake of FITC-dextran present in the culture media. Mean and standard deviations of wild type (AX4), srfB mutant (srfB) cells and mutant cells that express srfB (srfBsrfB2, srfBsrfB3) at 30 and 60 min of incubation are represented.
Fig. 10
Fig. 10
Developmental expression of srfB-regulated genes. RNA was obtained from wild type (AX4), srfB mutant (srfB) cells and mutant cells expressing srfB (srfBsrfB2) during proliferation (0) or at different developmental stages (2–10). The expression of the genes coding for actin cytoskeleton regulatory proteins (Ponticulin (ponA), cofilin 2 (cofC)), lysosomal proteins (preprocathepsin D (ctsD), lysozyme (alyB)), ribosomal proteins (ribosomal protein S12 (rps12)), and genes involved in multicellular development (Discoidin (dscB), countin (ctnA)) is shown. Ethidium bromide staining of representative gels is shown in the lower panel. Migration of the ribosomal RNAs is indicated to the right of each panel. The mRNAs corresponding to the genes analyzed in this figure migrated faster than the 17S ribosomal RNA.

References

    1. Adachi H., Hasebe T., Yoshinaga K., Ohta T., Sutoh K. Isolation of Dictyostelium discoideum cytokinesis mutants by restriction enzyme-mediated integration of the blasticidin S resistance marker. Biochem. Biophys. Res. Commun. 1994;205:1808–1814. - PubMed
    1. Agarwal A.K., Parrish S.N., Blumberg D.D. Ribosomal protein gene expression is cell type specific during development in Dictyostelium discoideum. Differentiation. 1999;65:73–88. - PubMed
    1. Aizawa H., Sutoh K., Yahara I. Overexpression of cofilin stimulates bundling of actin filaments, membrane ruffling, and cell movement in Dictyostelium. J. Cell Biol. 1996;132:335–344. - PMC - PubMed
    1. Aizawa H., Kishi Y., Iida K., Sameshima M., Yahara I. Cofilin-2, a novel type of cofilin, is expressed specifically at aggregation stage of Dictyostelium discoideum development. Genes Cells. 2001;6:913–921. - PubMed
    1. Alberti S., Krause S.M., Kretz O., Philippar U., Lemberger T., Casanova E., Wiebel F.F., Schwartz H.L., Frostscher M., Schutz G., Nordheim A. Neuronal migration in the murine rostral migratory stream requires serum response factor. Proc. Natl. Acad. Sci. U. S. A. 2005;102:6148–6153. - PMC - PubMed

Publication types