Review
. 2008 Jun 27;363(1500):2153-62.
doi: 10.1098/rstb.2008.2268.

Phase contrast electron microscopy: development of thin-film phase plates and biological applications

Affiliations
Review

Phase contrast electron microscopy: development of thin-film phase plates and biological applications

Kuniaki Nagayama et al. Philos Trans R Soc Lond B Biol Sci. .

Abstract

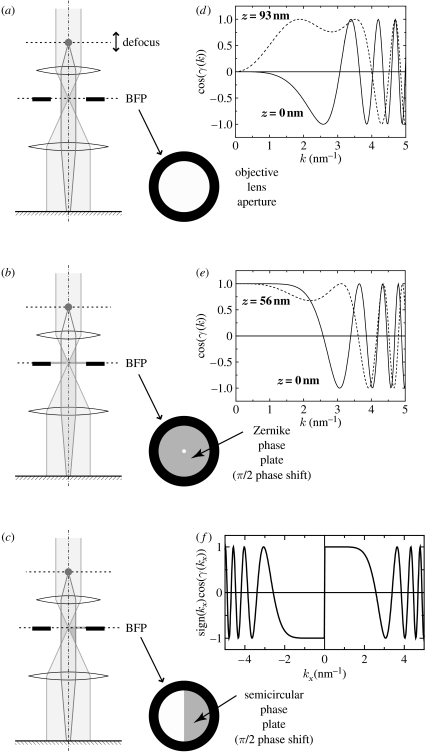
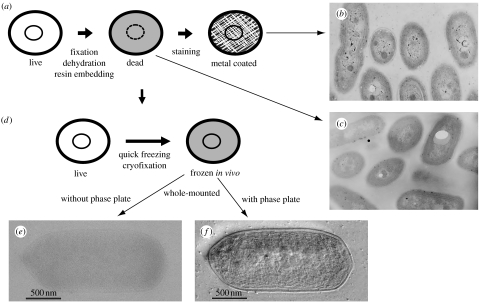
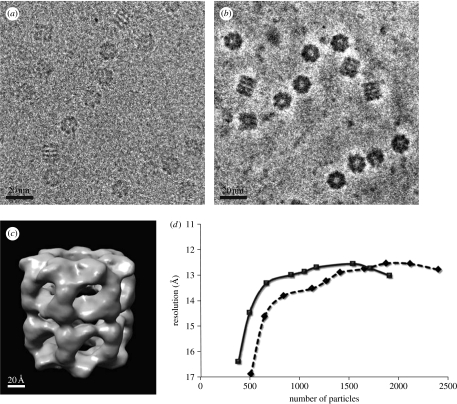
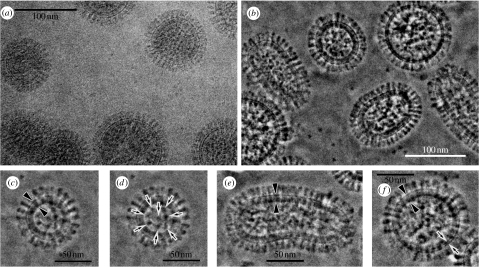
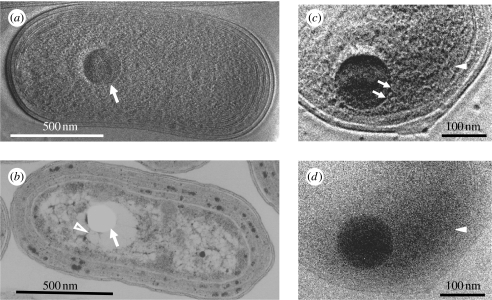
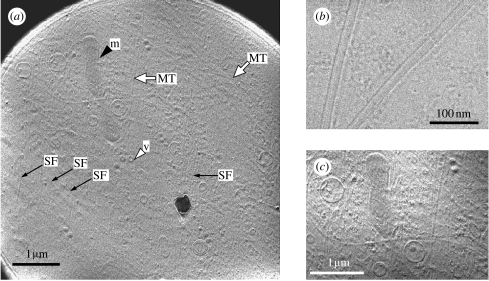
Phase contrast transmission electron microscopy (TEM) based on thin-film phase plates has been developed and applied to biological systems. Currently, development is focused on two techniques that employ two different types of phase plates. The first technique uses a Zernike phase plate, which is made of a uniform amorphous carbon film that completely covers the aperture of an objective lens and can retard the phase of electron waves by pi/2, except at the centre where a tiny hole is drilled. The other technique uses a Hilbert phase plate, which is made of an amorphous carbon film that is twice as thick as the Zernike phase plate, covers only half of the aperture and retards the electron wave phase by pi. By combining the power of efficient phase contrast detection with the accurate preservation achieved by a cryotechnique such as vitrification, macromolecular complexes and supermolecular structures inside intact bacterial or eukaryotic cells may be visualized without staining. Phase contrast cryo-TEM has the potential to bridge the gap between cellular and molecular biology in terms of high-resolution visualization. Examples using proteins, viruses, cyanobacteria and somatic cells are provided.


Figures

Figure 1
Figure 1
Three types of phase contrast methods. (a) Schematic illustrating the DPC with conventional TEM, in which contrast is adjusted by altering the defocus. (b) Contrast transfer function (CTFs) corresponding to DPC plotted against the modulus of the spatial frequency (k). (c) Schematic illustrating ZPC using a Zernike phase plate set at the back focal plane (BFP). (d) CTFs corresponding to ZPC plotted against the modulus of the spatial frequency (k) at the BFP. (e) Schematic illustrating the HDC using a Hilbert phase plate (semicircular phase plate) set at the BFP. (f) A CTF corresponding to HDC plotted against a unidirectional spatial frequency (kx). (b,d,f) 300 kV, λ=0.001968 nm and Cs=3 mm. Adapted from fig. 1 of Danev & Nagayama (2006).
Figure 2
Figure 2
(a) A standard sample preparation and (d) an improved sample preparation using a cryotechnique. TEM micrographs associated with the preparation techniques are compared (b,c,f). (b) Conventional TEM images of a standard cyanobacterial cell sample (100 kV). (c) Conventional TEM images of a standard cyanobacterial cell sample without staining (100 kV). (d) A sample preparation using quick freezing. (e) A conventional TEM image for a vitrified cyanobacterial cell with deep defocusing (300 kV). (f) An HDC-TEM image for a vitrified cyanobacterial cell with a Hilbert phase plate (300 kV). Images (e,f) were adapted from fig. 1 of Kaneko et al. (2005).
Figure 3
Figure 3
Single-particle analysis of a chaperonin GroEL based on ZPC-TEM. (a) A conventional TEM and (b) a ZPC-TEM micrograph of a vitrified GroEL sample obtained using a 300 kV TEM. (c) A three-dimensional reconstruction of GroEL with a nominal resolution of 1.23 nm. (d) Assessment of analysis efficiency by plotting the attained three-dimensional resolution against the number of particles sampled in the three-dimensional reconstruction (diamonds, CTEM; squares, ZPC-TEM). Adapted from figs. 3 and 5 of Danev & Nagayama (2008).
Figure 4
Figure 4
The 300 kV cryo-TEM images of vitrified influenza A viruses under (c) the plasma membrane and (d) an inner core. (a) A conventional TEM and (b) a ZPC-TEM micrograph for influenza A viruses. (c,d) Enlarged images of a spherical virion with a complete matrix layer (c, arrowheads) and an inner core (d, arrows). (e) An enlarged image of an elongated virion with a complete matrix layer (arrowheads). (f) An enlarged image of a spherical virion with a partial matrix layer (arrows). Adopted from figs. 1 and 2 of Yamaguchi et al. (2007).
Figure 5
Figure 5
The 300 kV cryo-TEM images of vitrified cyanobacterial cells. (a) A 300 kV HDC-TEM image of a vitrified cyanobacterial whole cell. Polyphosphate body (arrow) is prominent among detailed ultrastructures. (b) A 100 kV conventional TEM image of a chemically fixed, resin-embedded and sectioned cell stained with uranyl acetate and lead citrate. Polyphosphate body is lost during the process and leaves an empty hole in the section (arrow). DNA fibres (arrowhead) extend from the hole. (c) An enlarged 300 kV HDC-TEM image of a cyanobacterial sample cultured in a BrdU-containing medium for 24 hours. (d) An enlarged 300 kV conventional TEM image using the same view field and experimental conditions are the same as given in (c), except with the use of a Hilbert phase plate. Adopted from figs. 1 and 2 of Kaneko et al. (2007).
Figure 6
Figure 6
The 300 kV HDC-TEM images of a vitrified PtK2 whole cell. (a) An overall view of a PtK2 whole cell including microtubules (MT, white arrows), actin stress fibres (SF, black arrows) and different types of attached membranous organelles such as mitochondria (m, black arrowhead) and vesicles (v, white arrowhead). (b) An HDC-TEM image of vitrified microtubules purified in vitro. (c) A higher magnified view of (a) which is digitally contrast enhanced. Adopted from figs. 2, 5 and 6 of Setou et al. (2006).

References

    1. Badde H.G, Reimer L. Der Einfluβ einer streuenden Phasenplatte auf das elektronen mikroskopische Bild. Z. Naturforschg. 1970;25a:760–765.
    1. Böhm J, Frangekis A.S, Hegerl R, Nichol S, Typke D, Baumeister W. Toward detecting and identifying macromolecular in a celualr context: template matching applied to electron tomograms. Proc. Natl Acad. Sci. USA. 2000;97:14 245–14 250. doi:10.1073/pnas.230282097 - DOI - PMC - PubMed
    1. Balossier G, Bonnet N. Use of electrostatic phase plate in TEM. Transmission electron microscopy: improvement of phase and topographical contrast. Optik. 1981;58:361–376.
    1. Born M, Wolf E. 7th edn. Cambridge University Press; Cambridge, UK: 1999. Principle of optics.
    1. Comolli L, Downing K. Dose tolerance at helium and nitrogen temperatures for whole cell electron tomography. J. Struct. Biol. 2005;152:149–156. doi:10.1016/j.jsb.2005.08.004 - DOI - PubMed

Publication types

MeSH terms