Review
. 2008 Apr;29(4):632-41.
doi: 10.3174/ajnr.A1051. Epub 2008 Mar 13.

Diffusion tensor MR imaging and fiber tractography: theoretic underpinnings

Affiliations
Review

Diffusion tensor MR imaging and fiber tractography: theoretic underpinnings

P Mukherjee et al. AJNR Am J Neuroradiol. 2008 Apr.

Abstract

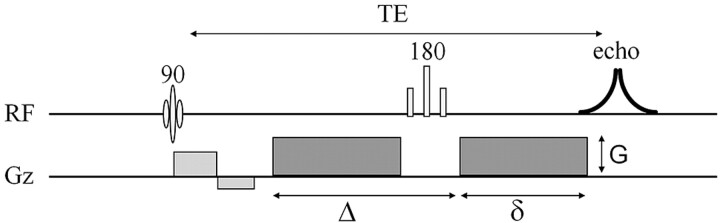
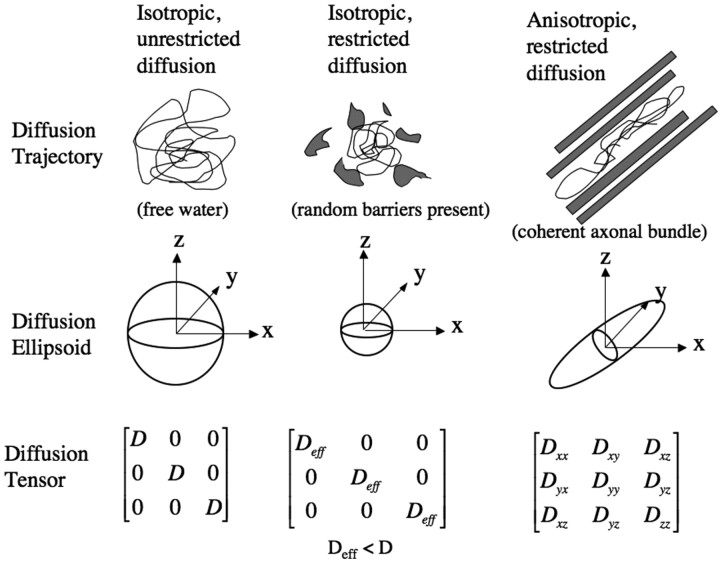
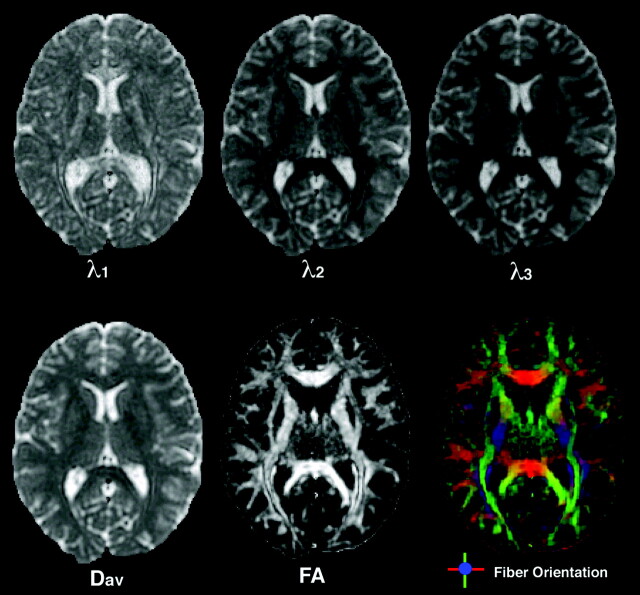
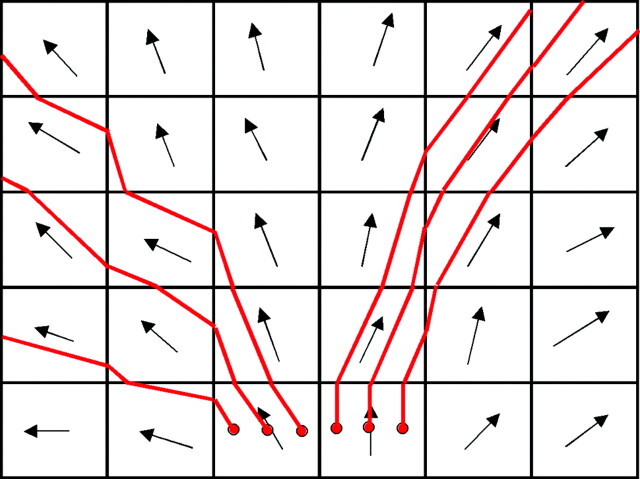
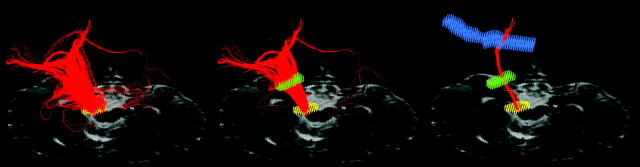
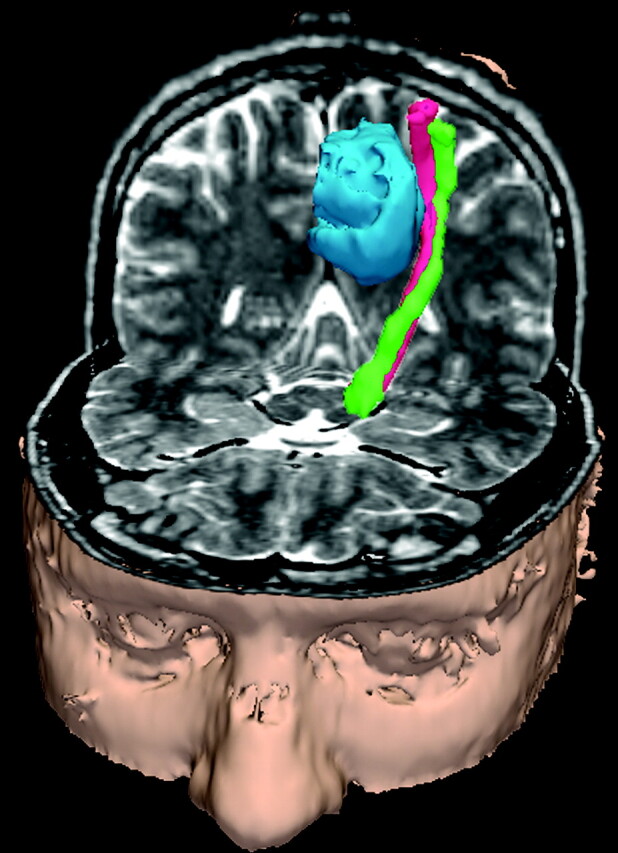
In this article, the underlying theory of clinical diffusion MR imaging, including diffusion tensor imaging (DTI) and fiber tractography, is reviewed. First, a brief explanation of the basic physics of diffusion-weighted imaging (DWI) and apparent diffusion coefficient (ADC) mapping is provided. This is followed by an overview of the additional information that can be derived from the diffusion tensor, including diffusion anisotropy, color-encoded fiber orientation maps, and 3D fiber tractography. This article provides the requisite background for the second article in this 2-part review to appear next month, which covers the major technical factors that affect image quality in diffusion MR imaging, including the acquisition sequence, magnet field strength, gradient amplitude and slew rate, and multichannel radio-frequency coils and parallel imaging. The emphasis is on optimizing these factors for state-of-the-art DWI and DTI based on the best available evidence in the literature.


Figures

Fig 1.
Fig 1.
Pulse sequence diagram for a diffusion-weighted acquisition shows that 2 diffusion-sensitizing gradients (dark gray) are added to a spin-echo sequence, 1 before and 1 after the 180° refocusing pulse. The diffusion-weighting factor b depends on the amplitude of the diffusion gradient (G), the duration of each diffusion gradient (δ), and the interval between the onset of the diffusion gradient before the refocusing pulse and that following the refocusing pulse (Δ). RF indicates radiofrequency pulses; Gz, gradient pulses.
Fig 2.
Fig 2.
DWI enables more sensitive and specific diagnosis of acute cerebral ischemia in a case of embolic infarcts due to endocarditis. A, Conventional spin-echo T2-weighted image shows only nonspecific white matter foci of signal hyperintensity. B, Combined DWI image at the same axial level reveals 3 punctuate hyperintense white matter lesions (arrows) that are suggestive of embolic infarcts. C, Corresponding ADC map confirms that there is reduced diffusion in these lesions (arrows), consistent with acute ischemia. D, Attenuation coefficient image, also known as the exponential diffusion image, shows these lesions as remaining hyperintense (arrows). This demonstrates that the hyperintensity on the combined DWI image is not due to T2 shinethrough artifact.
Fig 3.
Fig 3.
T2 shinethrough artifact in DWI. A, T2-weighted fluid-attenuated inversion recovery image shows numerous nonspecific periventricular and subcortical hyperintense foci, as well as a larger wedge-shaped region of hyperintensity in the right parietal lobe suggestive of infarct. B, Combined DWI image at the same axial level reveals that the right parietal abnormality is hyperintense, suggesting acute ischemia. C, Corresponding ADC map demonstrates elevated mean diffusivity within the abnormal region, consistent with chronic infarction. D, Low signal intensity within the lesion on the attenuation coefficient image confirms that the DWI signal-intensity hyperintensity is due to T2 shinethrough and does not reflect reduced diffusion as would be seen in an acute infarct.
Fig 4.
Fig 4.
The diffusion ellipsoids and tensors for isotropic unrestricted diffusion, isotropic restricted diffusion, and anisotropic restricted diffusion are shown.
Fig 5.
Fig 5.
Top row: The first, second, and third eigenvalues are shown with the same intensity scaling. Note that the eigenvalues are always ordered in descending order of intensity with the first eigenvalue being the greatest. Bottom left: The directionally averaged diffusivity is the mean of the 3 eigenvalues. Bottom middle: The FA indicates the coherence of white matter bundles. Bottom right: The FA map can be colorized to show the orientation of the primary eigenvector with left-to-right oriented axonal fibers green, anterior-to-posterior fibers red, and inferior-to-superior fibers blue. Colors are additively mixed to represent fiber populations oriented between these 3 cardinal axes.
Fig 6.
Fig 6.
Schematic demonstrating the FACT algorithm. Arrows represent primary eigenvectors in each voxel. Red lines are FACT trajectories.
Fig 7.
Fig 7.
Multiple regions of interest are used with the FACT algorithm to delineate the corticospinal tract. Left: Fiber tracks (red) are generated from a region drawn in the cerebral peduncle (yellow voxels). Middle: Streamlines also passing through a region drawn in the posterior limb of the internal capsule (green voxels) are retained. Right: The final set of streamlines most closely corresponding to the corticospinal tract passes through the centrum semiovale (blue) in addition to the internal capsule and cerebral peduncle regions.
Fig 8.
Fig 8.
DTI fiber tracks reveal the course of the corticospinal tract along the border of a brain tumor (blue). Streamlines were launched from wrist (green) and shoulder (red) motor stimulation sites on the cortex. The wrist and shoulder motor streamlines twist about each other as they descend from the cortex through the internal capsule to the cerebral peduncle.
Fig 9.
Fig 9.
DTI fiber tracks of the optic radiation in a 35-week gestational age premature infant. Streamlines were generated with the FACT algorithm and are colored according to the underlying FA in the voxels that the streamlines pass through. The proximal segment of the optic radiations, near the lateral geniculate nucleus, has the highest anisotropy.

References

    1. Einstein A. Investigations on the Theory of the Brownian Movement. New York: Dover;1956
    1. Le Bihan D, Breton E, Lallemand D, et al. MR imaging of intravoxel incoherent motions: application to diffusion and perfusion in neurologic disorders. Radiology 1986;161:401–07 - PubMed
    1. Le Bihan D, Breton E, Lallemand D, et al. Separation of diffusion and perfusion in intravoxel incoherent motion MR imaging. Radiology 1988;168:497–505 - PubMed
    1. Thomsen C, Henriksen O, Ring P. In vivo measurement of water self diffusion in the human brain by magnetic resonance imaging. Acta Radiol 1987;28:353–61 - PubMed
    1. Turner R, Le Bihan D, Maier J, et al. Echo-planar imaging of intravoxel incoherent motion. Radiology 1990;177:407–14 - PubMed