

Quantitative differentiation between healthy and disordered brain matter in patients with neurofibromatosis type I using diffusion tensor imaging
- PMID: 18339726
- PMCID: PMC7978201
- DOI: 10.3174/ajnr.A0921
Quantitative differentiation between healthy and disordered brain matter in patients with neurofibromatosis type I using diffusion tensor imaging
Abstract
Background and purpose: Hyperintensities on T2-weighted images are seen in the brains of most patients with neurofibromatosis type I (NF-1), but the origin of these unidentified bright objects (UBOs) remains obscure. In the current study, we examined the diffusion characteristics of brain tissue in children with NF-1 to test the hypothesis that a microstructural abnormality is present in NF-1.
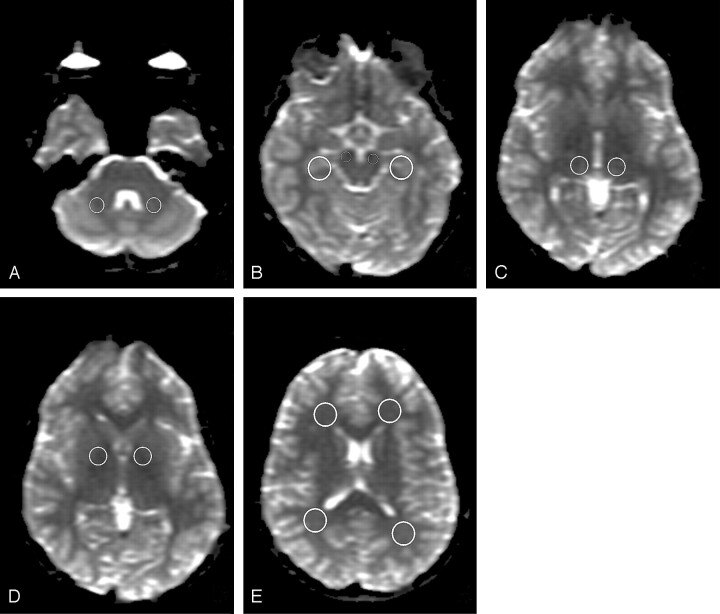
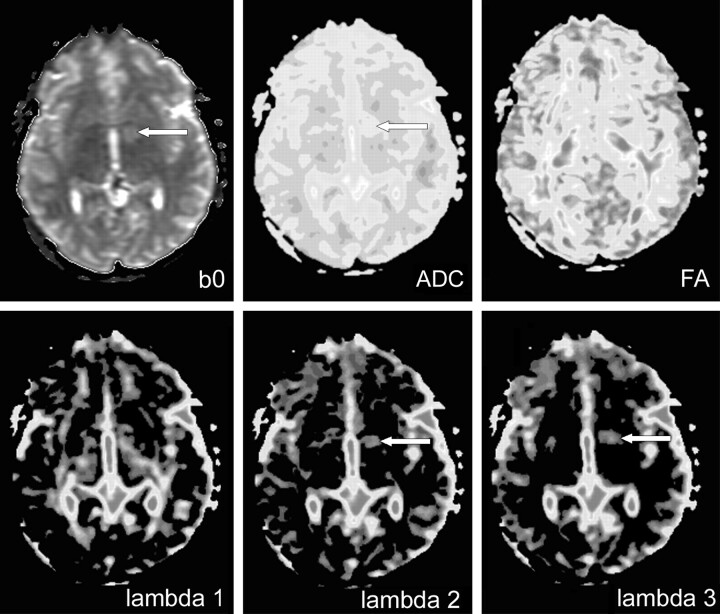
Materials and methods: Diffusion tensor imaging (DTI) was performed in 50 children with NF-1 and 8 controls. Circular regions of interest were manually placed in 7 standardized locations in both hemispheres, including UBO sites. Apparent diffusion coefficients (ADC), fractional anisotropy (FA), and axial anisotropy (A(m)) were used to differentiate quantitatively between healthy and disordered brain matter. Differences in eigenvalues (lambda(1), lambda(2), lambda(3)) were determined to examine parenchymal integrity.
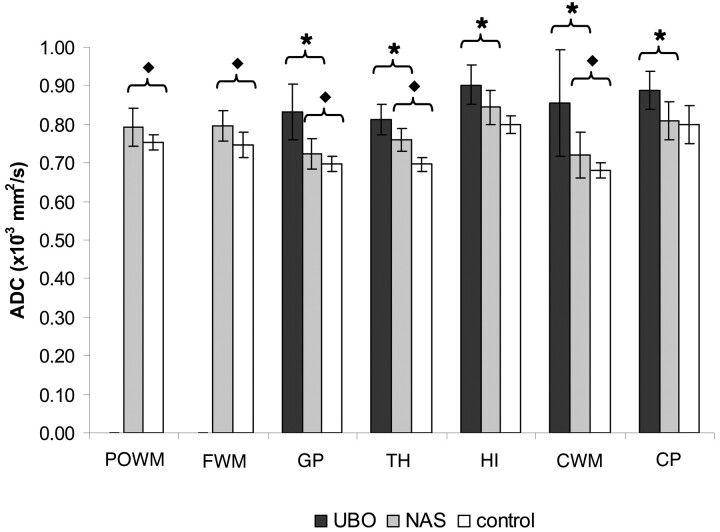
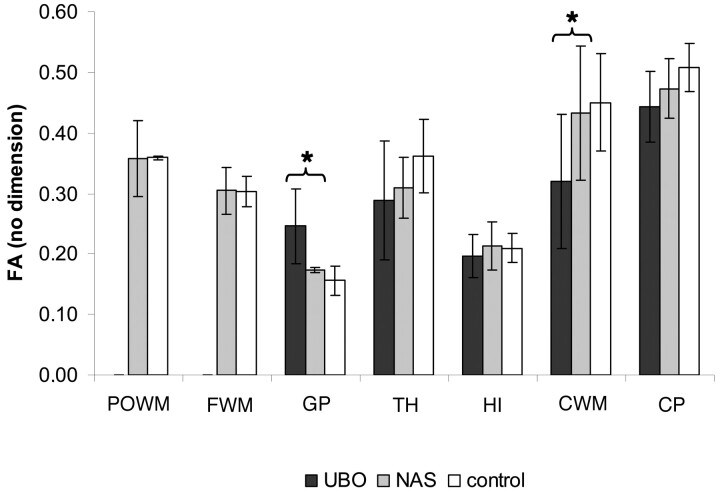
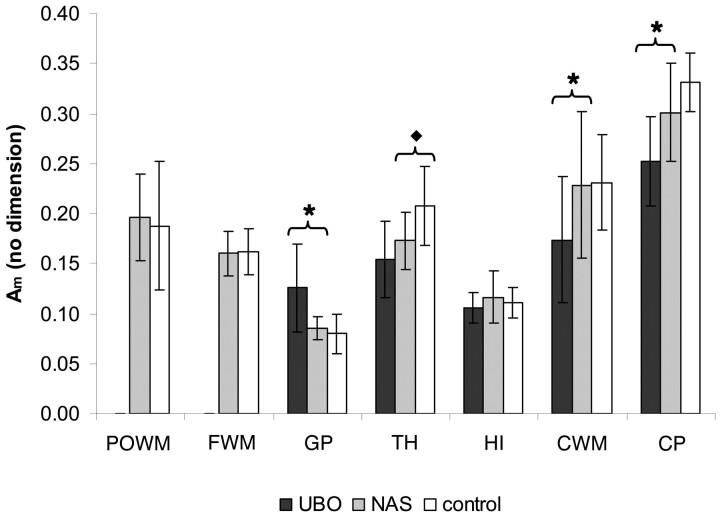
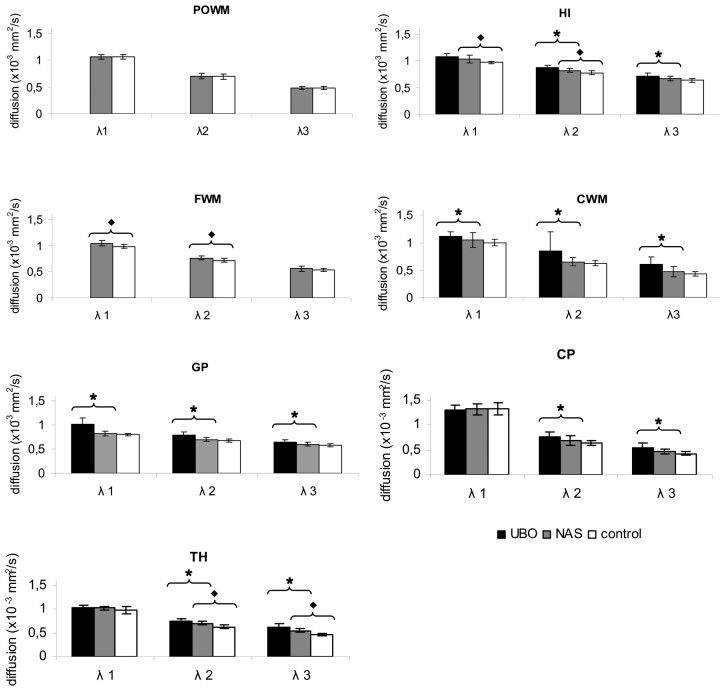
Results: We found higher ADC values for UBOs than for normal-appearing sites (P < .01) and higher ADC values for normal-appearing sites than for controls (P < .04 in 5 of 7 regions). In most regions, we found no differences in FA or A(m). Eigenvalues lambda(2) and lambda(3) were higher at UBO sites than in normal-appearing sites (P < .04).
Conclusion: With ADC, it was possible to differentiate quantitatively between normal- and abnormal-appearing brain matter in NF-1 and also between normal-appearing brain matter in NF-1 and healthy brain matter in controls, indicating subtle pathologic damage disrupting the tissue microstructure in the NF-1 brain. Higher diffusivity for lambda(1), lambda(2), and lambda(3) indicates that this disturbance of microstructure is caused by accumulation of fluid or vacuolation.
Figures
Similar articles
-
Characterizing the microstructural basis of "unidentified bright objects" in neurofibromatosis type 1: A combined in vivo multicomponent T2 relaxation and multi-shell diffusion MRI analysis.Neuroimage Clin. 2014 Apr 13;4:649-58. doi: 10.1016/j.nicl.2014.04.005. eCollection 2014. Neuroimage Clin. 2014. PMID: 24936416 Free PMC article.
-
Brain apparent diffusion coefficient evaluation in pediatric patients with neurofibromatosis type 1.J Comput Assist Tomogr. 2005 May-Jun;29(3):298-304. doi: 10.1097/01.rct.0000162406.71300.b7. J Comput Assist Tomogr. 2005. PMID: 15891494
-
Contribution of diffusion tensor MR imaging in detecting cerebral microstructural changes in adults with neurofibromatosis type 1.AJNR Am J Neuroradiol. 2007 Apr;28(4):773-6. AJNR Am J Neuroradiol. 2007. PMID: 17416837 Free PMC article.
-
The role of diffusion tensor imaging in the evaluation of ischemic brain injury - a review.NMR Biomed. 2002 Nov-Dec;15(7-8):561-9. doi: 10.1002/nbm.786. NMR Biomed. 2002. PMID: 12489102 Review.
-
Diffusion-weighted MR of the brain: methodology and clinical application.Radiol Med. 2005 Mar;109(3):155-97. Radiol Med. 2005. PMID: 15775887 Review. English, Italian.
Cited by
-
Alterations in white matter microstructure in neurofibromatosis-1.PLoS One. 2012;7(10):e47854. doi: 10.1371/journal.pone.0047854. Epub 2012 Oct 19. PLoS One. 2012. PMID: 23094098 Free PMC article.
-
Gender-Specific Fine Motor Skill Learning Is Impaired by Myelin-Targeted Neurofibromatosis Type 1 Gene Mutation.Cancers (Basel). 2024 Jan 23;16(3):477. doi: 10.3390/cancers16030477. Cancers (Basel). 2024. PMID: 38339230 Free PMC article.
-
Nf1 loss and Ras hyperactivation in oligodendrocytes induce NOS-driven defects in myelin and vasculature.Cell Rep. 2013 Sep 26;4(6):1197-212. doi: 10.1016/j.celrep.2013.08.011. Epub 2013 Sep 12. Cell Rep. 2013. PMID: 24035394 Free PMC article.
-
Magnetic resonance diffusion tensor imaging (MRDTI) of the optic nerve and optic radiations at 3T in children with neurofibromatosis type I (NF-1).Pediatr Radiol. 2012 Feb;42(2):168-74. doi: 10.1007/s00247-011-2216-y. Epub 2011 Aug 21. Pediatr Radiol. 2012. PMID: 21858653
-
Lifelong Management of Neurofibromatosis 1 Patients.J Korean Neurosurg Soc. 2025 May;68(3):261-271. doi: 10.3340/jkns.2025.0057. Epub 2025 Apr 16. J Korean Neurosurg Soc. 2025. PMID: 40235035 Free PMC article.
References
-
- Aoki S, Barkovich AJ, Nishimura K, et al. Neurofibromatosis types 1 and 2: cranial MR findings. Radiology 1989;172:527–34 - PubMed
-
- North K. Neurofibromatosis type 1. Am J Med Genet 2000;97:119–27 - PubMed
-
- Menor F, Marti-Bonmati L, Mulas F, et al. Imaging considerations of central nervous system manifestations in pediatric patients with neurofibromatosis type 1. Pediatr Radiol 1991;21:389–94 - PubMed
-
- DiPaolo DP, Zimmerman RA, Rorke LB, et al. Neurofibromatosis type I: pathologic substrate of high-signal-intensity foci in the brain. Radiology 1995;195:721–24 - PubMed
Publication types
MeSH terms
LinkOut - more resources
Full Text Sources
Research Materials
Miscellaneous