. 2008 Jul;95(1):435-50.
doi: 10.1529/biophysj.107.123018. Epub 2008 Mar 13.

Both MHC class II and its GPI-anchored form undergo hop diffusion as observed by single-molecule tracking

Affiliations

Both MHC class II and its GPI-anchored form undergo hop diffusion as observed by single-molecule tracking

Yasuhiro M Umemura et al. Biophys J. 2008 Jul.

Abstract

Previously, investigations using single-fluorescent-molecule tracking at frame rates of up to 65 Hz, showed that the transmembrane MHC class II protein and its GPI-anchored modified form expressed in CHO cells undergo simple Brownian diffusion, without any influence of actin depolymerization with cytochalasin D. These results are at apparent variance with the view that GPI-anchored proteins stay with cholesterol-enriched raft domains, as well as with the observation that both lipids and transmembrane proteins undergo short-term confined diffusion within a compartment and long-term hop diffusion between compartments. Here, this apparent discrepancy has been resolved by reexamining the same paradigm, by using both high-speed single-particle tracking (50 kHz) and single fluorescent-molecule tracking (30 Hz). Both molecules exhibited rapid hop diffusion between 40-nm compartments, with an average dwell time of 1-3 ms in each compartment. Cytochalasin D hardly affected the hop diffusion, consistent with previous observations, whereas latrunculin A increased the compartment sizes with concomitant decreases of the hop rates, which led to an approximately 50% increase in the median macroscopic diffusion coefficient. These results indicate that the actin-based membrane skeleton influences the diffusion of both transmembrane and GPI-anchored proteins.


Figures
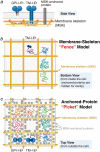
FIGURE 1
FIGURE 1
Proposed mechanisms for the compartmentalization of the plasma membrane for the translational diffusion of transmembrane proteins and GPI-anchored proteins in the membrane: corralling by the membrane-skeleton “fences” and the anchored-protein “pickets.” The plasma membrane may be parceled up into closely apposed domains (compartments) for the translational diffusion of transmembrane proteins and lipids (or GPI-anchored proteins). All of the membrane constituent molecules undergo short-term confined diffusion within a compartment and long-term hop diffusion between these compartments. This may be due to corralling by two mechanisms: the membrane-skeleton “fences” and the anchored-protein “pickets.” In this study, we examined two varieties of MHC class II molecules, I-Ek (I-Ek indicates the k allele in the I-E region): the native single-pass transmembrane type (TM-I-Ek) and a modified protein with a GPI-anchor (GPI-I-Ek). Both the GPI-linked and TM-I-Ek molecules share the same extracellular domain. In GPI-I-Ek, the cytoplasmic and transmembrane moieties of the TM-I-Ek are replaced by two GPI-linkers that tether it to the outer leaflet of the plasma membrane (72). These molecules were expressed in CHO cells, and those located in the upper plasma membrane were observed. (a) The side-view schematic representation of TM-I-Ek, GPI-I-Ek, and an MSK-anchored protein (membrane skeleton-anchored proteins, gray cylinder). The former two molecules are mobile, whereas MSK-anchored proteins are immobile. (b) The membrane-skeleton “fence” or “corral” model, showing that transmembrane proteins are confined within the mesh of the actin-based membrane skeleton, as viewed from inside the cell. Meanwhile lipids and GPI-anchored proteins, located in the outer leaflet of the membrane, do not directly interact with the membrane skeleton. (c) The anchored-protein “picket” model, showing MSK-anchored proteins, effectively represent the immobile obstacles to the diffusion of transmembrane proteins, lipids, and GPI-anchored proteins, as viewed from outside the cell.
FIGURE 2
FIGURE 2
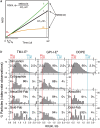
Experimental design for single fluorescent-molecule tracking (SFMT, left) and single-particle tracking (SPT, right). (Left) Single fluorescent-molecule tracking (SFMT), carried out at video rate (30 Hz; 33-ms resolution), providing the effective diffusion coefficient on the timescale of 100 ms, Deff(33ms)100ms. TM-I-Ek and GPI-I-Ek were labeled with either Alexa594-conjugated anti-I-Ek Fab fragments or the Cy3-tagged peptide (Moth Cytochrome c peptide, MCC 95–103 (IAYLKQATK)) at its N-terminus. Alexa594-conjugated DOPE was incorporated in the cell membrane. (right) Single-particle tracking (SPT), carried out at a 50,000 Hz frame rate (20-μs resolution), providing the compartment size sensed by the diffusant. TM-I-Ek and GPI-I-Ek were labeled with anti-I-Ek Fab fragments and then labeled with gold probes coated with anti-mouse IgG antibodies' Fab fragments. For SPT of DOPE, gold probes coated with anti-fluorescein antibody Fab fragments were bound to fluorescein-DOPE, which was preincorporated in the cell membrane (5,6).
FIGURE 3
FIGURE 3
Representative trajectories and ensemble-averaged MSDt plots for TM-I-Ek, GPI-I-Ek, and DOPE observed at a 33-ms resolution. (a) Representative trajectories in the CHO cell plasma membrane for 3 s (total number of frames, N, is 90). The colors (purple, cyan, green, orange, and red) represent the passage of time (every 600 ms or 18 video frames). (b) Ensemble-averaged mean-square displacement (MSD) as a function of time (t) for TM-I-Ek, GPI-I-Ek, and DOPE averaged over all molecules examined in this study. (Cyan line) Cy3-peptide probe. (Red line) Alexa594-Fab probe for TM-I-Ek and GPI-I-Ek or Alexa594-DOPE. Ensemble-averaged MSDt plots for these molecules were fitted by straight lines in the range between 0 and 1 s. Deff(33ms)500ms values of TM-I-Ek, GPI-I-Ek, and DOPE with Alexa594-Fab probes were 0.13, 0.25, and 0.12 μm2/s, respectively. Deff(33ms)500ms values of TM-I-Ek and GPI-I-Ek with Cy3-peptide probes were 0.13 and 0.24 μm2/s, respectively. The averaged MSD values for TM-I-Ek, GPI-I-Ek, and DOPE were obtained by averaging the corrected MSD of each molecule over all molecules. The corrected MSD for each molecule was obtained by subtracting the y intercept of the straight line fitted for MSD(2δt), MSD(3δt), and MSD(4δt) (as noise) from the uncorrected MSD for each molecule (16). Error bars for each ensemble-averaged MSD represent standard errors. For the viewability of the plots, the experimentally obtained points of TM-I-Ek and those of GPI-I-Ek are alternatingly shown.
FIGURE 4
FIGURE 4
Theoretical curves for MSDt plots of simple Brownian diffusion, directed diffusion, and confined diffusion, and the distributions of RD(N, n) for TM-I-Ek, GPI-I-Ek, and DOPE, observed at video rate (30 Hz), employing fluorescent and colloidal-gold probes (N = 90; n = 30). (a) Theoretical curves for simple Brownian diffusion (I), directed diffusion (II), and confined-hop diffusion (III) are shown for two-dimensional diffusion. The curves were plotted according to the equations in Classification of the Mode of Diffusion, Calculation of the Diffusion Coefficient, and Analysis of the High-Speed SPT Trajectories. The graphs were drawn assuming that the short-term diffusion coefficients (1/4 of the initial slope at Δt = 0) are the same for all of the cases. RD(N, n) where N = total number of frames and n = time windows for the analysis, is defined as the ratio of an experimental MSD(nδt) to the fictitious MSD at time nδt (4D2–4nδt), assuming that the molecule undergoes simple Brownian diffusion without confinement or directed diffusion with a diffusion coefficient determined from the initial slope (4D2–4 is the slope determined from a linear fit to the MSD values at the second, third, and fourth steps of elapsed time, shown as red line). The larger the RD is from 1, the higher the probability of directed diffusion. Meanwhile, the smaller the RD is from 1, the higher the probability of confined-diffusion. (b) The distribution of RD(N, n) = MSD(N, n)/[4 × Deff(33ms)100ms × 0.033n] for N = 90 and n = 30, i.e., the ratio of the observed MSD(N, n) averaged over an N-step trajectory versus the MSD(N, n) expected from the initial slope of the MSDt curve (averaged over the N-step trajectory). Here, N (the total trajectory length) = 90 frames, and the analysis time window n = 30 steps (1 s). For the classification of the trajectories into different diffusion modes, first, many simple Brownian trajectories were generated by Monte Carlo simulation to determine the distribution of RD(90, 30) for simple Brownian particles, and then RD(90, 30) values of 2.5% of population at each edge of the distribution were taken as limits to simple Brownian behavior and are referred to as RD(90, 30)min (red line) and RD(90, 30)max (cyan line) (16). If a molecule (a particle) exhibits an RD(90, 30) <RDmin(90, 30), between RDmin(90, 30) and RDmax(90, 30), or >RDmax(90, 30), then it is classified as having a confined-hop, simple Brownian, or directed diffusion mode, respectively. The sum of the percent values may not be 100 due to the presence of immobile fluorescent spots (all of the gold particles attached to the plasma membrane were mobile). The majority of the TM-I-Ek, GPI-I-Ek, and DOPE (mobile) trajectories were classified into the simple Brownian mode, irrespective of the probes employed here.
FIGURE 5
FIGURE 5
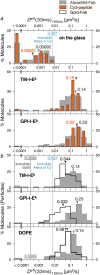
Distributions of the effective diffusion coefficients for a 100-ms window, Deff(33ms)100ms, using different probes. (a) (Top) Determination of the lowest Deff(33ms)100ms distinguishable from the immobile spot (this is determined by the noise level). Alexa594-Fab (gray bars) or Cy3-peptide (orange bars) attached to the cover glass exhibited the nominal Deff(33ms)100ms in the range below 0.009 μm2/s (median values shown by arrowheads). Due to statistical dispersion of MSD values, many trajectories gave negative values for Deff(33ms)100ms, which are represented by a bar for spots exhibiting 0.0001 μm2/s or smaller. A spot exhibiting the top 2.5 percentile value in this distribution was selected as the lowest detectable limit for Deff(33ms)100ms, i.e., 0.007 μm2/s (shown by the cyan line). Any spot exhibiting a Deff(33ms)100ms value < 0.007 μm2/s was classified into the immobile mode in this experiment (in the sense that it cannot be distinguished from the immobilized probe on the coverslip). (Middle and bottom boxes) TM-I-Ek and GPI-I-Ek labeled with Alexa594-Fab (gray bars) or Cy3-peptide (orange bars), showing no statistically significant difference between the Fab and peptide probes. Arrowheads indicate the median values. There were no significant differences in these diffusion coefficients between the labels. GPI-I-Ek diffused 1.6-fold faster than TM-I-Ek and DOPE (the Wilcoxon statistical test result; p < 0.05, also see b). (b) TM-I-Ek and GPI-I-Ek were labeled with colloidal-gold probes coated with the MPA of anti-mouse IgG-antibody Fab, whereas DOPE was labeled with gold probes coated with the threefold MPA of the anti-fluorescein antibodies' Fab fragments in the presence of the free anti-fluorescein antibodies' Fab fragments. Gold probes (open bars with black outlines) exhibited diffusion coefficients 3–7-fold smaller than fluorescent Alexa probes (gray bars), probably due to steric hindrance and/or crosslinking. The lower-limit of the diffusion coefficients that can be evaluated by SPT of gold-Fab was 0.0003 μm2/s, which is indicated by a black vertical line (at video rate; 16). No gold-tagged molecule was classified into the immobile mode.
FIGURE 6
FIGURE 6
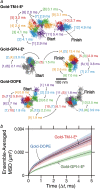
TM-I-Ek, GPI-I-Ek, and DOPE, tagged with gold particles and observed at a 20-μs resolution, exhibited hop diffusion. (a) Representative 40-ms trajectories (containing 2000 determined coordinates) of TM-I-Ek, GPI-I-Ek, and DOPE. Each color (purple, cyan, green, orange, red, and then back to purple and so on; this sequence was always used in this article) represents a plausible compartment detected by computer software (5). The residency time within each compartment is shown and is color-coordinated with respective compartment. The numbers in the square brackets indicate the order of the compartments the molecules entered. In the Gold-GPI-I-Ek and Gold-DOPE trajectories, due to repeated entrance into the same compartments, the continuous trajectories of GPI-I-Ek and DOPE were shown in two separate trajectories placed side-by-side for the viewability, whereas the overall trajectories except for the portions shown in colored trajectories are displayed in gray lines. When repeated passages across the same compartment took place in these trajectories, the compartment is numbered by two numbers. These results suggest that the compartments move slightly even during 2–20 ms. (b) Ensemble-averaged MSDt plots. Mean-square displacement (MSD) of TM-I-Ek, GPI-I-Ek, and DOPE tagged with gold particles observed at a 20-μs resolution, averaged over all copies of molecules examined here. (Red) TM-I-Ek. (Green) GPI-I-Ek. (Blue) DOPE. The MSD corrected for the single-step noise was obtained as described in the caption to Fig. 3 b. The error bar for each ensemble-averaged MSDt) represents the standard error. These plots were fitted with theoretical curves representing hop diffusion over equally spaced, semipermeable barriers (52). For further details of the analysis, see Suzuki et al. (19). For the plots for TM-I-Ek and DOPE, due to the overlap of the points, only half of the experimentally obtained points for these molecules are alternatingly plotted. The smaller long-term slope for GPI-I-Ek is likely due to the greater tendency of GPI-I-Ek clustering beneath the gold-particle probes (see the text).
FIGURE 7
FIGURE 7
The distributions of RD(N, n) for TM-I-Ek, GPI-I-Ek, and DOPE tagged with gold particles observed at a 20-μs resolution. The distributions of RD(N, n) for TM-I-Ek, GPI-I-Ek, and DOPE (second to bottom rows) are quite different from those expected from simple Brownian particles (generated by Monte Carlo stimulations, top row). Here, N was fixed at 5000, and n was varied (100, 250, and 400 steps, corresponding to analysis time windows of 2, 5, and 8 ms, respectively). For the classification of the trajectories into different diffusion modes, RD(5000, n) values that gave the 2.5 percentile of the particles from both ends of the distribution for simulated simple Brownian trajectories, referred to as RDmin(5000, n) and RDmax(5000, n), shown by red and cyan vertical lines in all panels, respectively, were used (16). When a particle exhibited an RD(5000, n) smaller than RDmin(5000, n), its trajectory was classified into the confined-hop diffusion mode. The percent number (red) to the left of the red line indicated the fraction of trajectories classified into the confined-hop diffusion mode, showing that the majority of the TM-I-Ek, GPI-I-Ek, and DOPE trajectories are classified into the confined-hop diffusion mode.
FIGURE 8
FIGURE 8
At a 20-μs resolution (with gold probes), TM-I-Ek, GPI-I-Ek, and DOPE exhibited rapid hop diffusion between ∼40-nm compartments with a median dwell time of 4–7 ms in each compartment. The distributions of compartment sizes and the apparent residency times for TM-I-Ek (red), GPI-I-Ek (green), and DOPE (blue). The compartment size L was obtained by fitting the MSDt plot for each trajectory with a theoretical curve for hop diffusion (52), and the residency time was calculated from L and DMACRO, also obtained from the curve fitting (L2/4DMACRO). Color-coordinated arrows and numbers show medians of respective distributions. All three gold-particle-tagged molecules exhibited similar compartment sizes and residency times within a compartment. These residency times are prolonged due to cross-linking by gold probes. The “corrected” residency time can be evaluated by using the macroscopic diffusion rate of a fluorescently-tagged molecule (median value) and the compartment size obtained by a gold-tagged molecule (median value), and is listed in Table 2. The numbers in the parentheses indicate the “corrected” residency times.
FIGURE 9
FIGURE 9
The distributions of the compartment sizes (left) and the residency times (right) after latrunculin A or cytochalasin D treatment. Latrunculin A (final 1 μM, observed between 5 and 20 min, red open bars) or cytochalasin D (final 10 μM, observed between 2 and 12 min, cyan open bars) was added to the cultured cells on the microscope stage (control: gray bars). Arrowheads indicate median values. Upon the latrunculin A treatment, larger compartments appeared, with the median diameter increased by a factor of ∼1.5, or the area by a factor of ∼2.3 (the Wilcoxon statistical test result, comparing treated and untreated cells; p < 0.05). Meanwhile, the apparent residency times were not affected at a statistically meaningful level. However, the treatment with cytochalasin D had no effect (all p > 0.05), as reported previously using slower observation rates (1). These results indicate the necessity for caution in interpreting the pharmacological data.
FIGURE 10
FIGURE 10
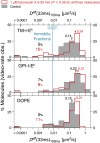
Latrunculin A treatment increased the effective macroscopic diffusion coefficients, Deff(33ms)100ms, of TM-I-Ek, GPI-I-Ek, and DOPE, tagged with Alexa594-Fab (red open bars, after the treatment; gray bars, before the treatment). All of the observations were carried out between 5 and 20 min after the addition of 1 μM latrunculin A. Color-coordinated arrows and numbers show medians of the respective Deff(33ms)100ms distributions. The cyan line represents the lowest detectable mobile Deff(33ms)100ms of 0.007 μm2/s (defined in Fig. 5 a). Color-coordinated percent values shown to the left of the cyan line in all panels represent the immobile fraction. Latrunculin A treatment increased the effective macroscopic diffusion coefficients of all three molecules (the Wilcoxon statistical test result between treated and untreated cells; p < 0.05).

Similar articles

Cited by

References

    1. Vrljic, M., S. Y. Nishimura, S. Brasselet, W. E. Moerner, and H. M. McConnell. 2002. Translational diffusion of individual class II MHC membrane proteins in cells. Biophys. J. 83:2681–2692. - PMC - PubMed
    1. Vrljic, M., S. Y. Nishimura, W. E. Moerner, and H. M. McConnell. 2005. Cholesterol depletion suppresses the translational diffusion of class II major histocompatibility complex proteins in the plasma membrane. Biophys. J. 88:334–347. - PMC - PubMed
    1. Nishimura, S. Y., M. Vrljic, L. O. Klein, H. M. McConnell, and W. E. Moerner. 2006. Cholesterol depletion induces solid-like regions in the plasma membrane. Biophys. J. 90:927–938. - PMC - PubMed
    1. Kusumi, A., and Y. Sako. 1996. Cell surface organization by the membrane skeleton. Curr. Opin. Cell Biol. 8:566–574. - PubMed
    1. Fujiwara, T., K. Ritchie, H. Murakoshi, K. Jacobson, and A. Kusumi. 2002. Phospholipids undergo hop diffusion in compartmentalized cell membrane. J. Cell Biol. 157:1071–1081. - PMC - PubMed

MeSH terms

Substances