. 2008 Jul;95(1):88-104.
doi: 10.1529/biophysj.107.122507. Epub 2008 Mar 13.

A biophysically based mathematical model of unitary potential activity in interstitial cells of Cajal

Affiliations

A biophysically based mathematical model of unitary potential activity in interstitial cells of Cajal

R A Faville et al. Biophys J. 2008 Jul.

Abstract

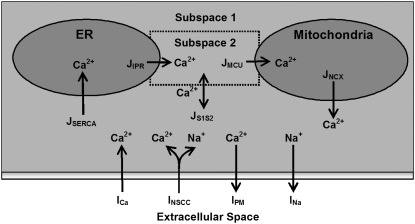
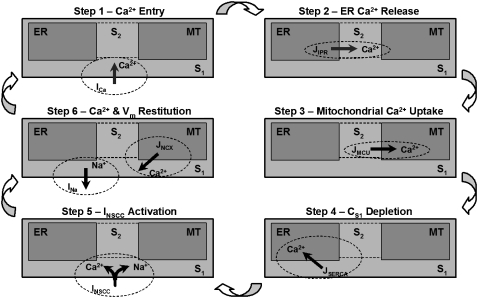
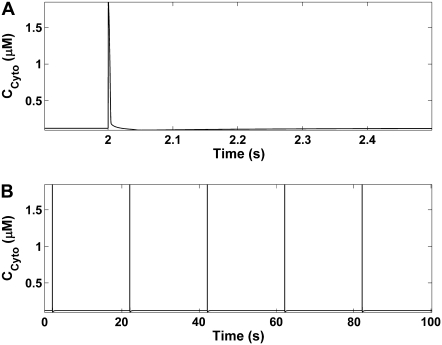
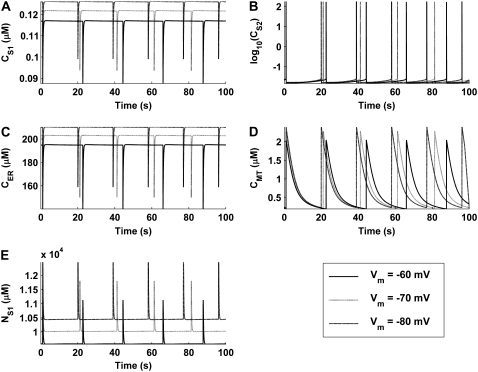
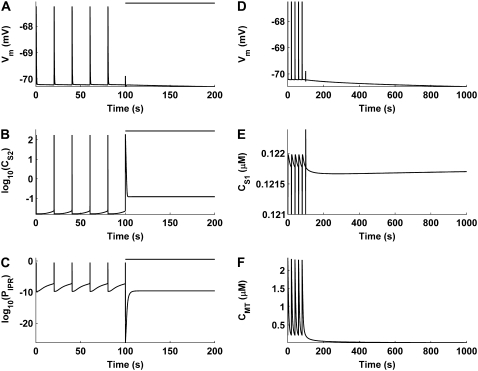
Unitary potential (UP) depolarizations are the basic intracellular events responsible for pacemaker activity in interstitial cells of Cajal (ICCs), and are generated at intracellular sites termed "pacemaker units". In this study, we present a mathematical model of the transmembrane ion flows and intracellular Ca(2+) dynamics from a single ICC pacemaker unit acting at near-resting membrane potential. This model quantitatively formalizes the framework of a novel ICC pacemaking mechanism that has recently been proposed. Model simulations produce spontaneously rhythmic UP depolarizations with an amplitude of approximately 3 mV at a frequency of 0.05 Hz. The model predicts that the main inward currents, carried by a Ca(2+)-inhibited nonselective cation conductance, are activated by depletion of sub-plasma-membrane [Ca(2+)] caused by sarcoendoplasmic reticulum calcium ATPase Ca(2+) sequestration. Furthermore, pacemaker activity predicted by our model persists under simulated voltage clamp and is independent of [IP(3)] oscillations. The model presented here provides a basis to quantitatively analyze UP depolarizations and the biophysical mechanisms underlying their production.


Figures

FIGURE 1
FIGURE 1
Schematic diagram of the ICC pacemaker unit showing all the components involved in the UP modeling framework. Displayed are the ionic conductances and their respective interactions with the intracellular organelles and cytoplasmic subspaces. The four compartmental volumes comprising the pacemaker unit are 1), the endoplasmic reticulum (ER); 2), the mitochondria; 3), the cytoplasmic subspace 1; and 4), the cytoplasmic subspace 2. The four plasma membrane currents that regulate cellular electrophysiology are 1), the inward Ca2+ current (ICa); 2), the nonselective cation conductance (INSCC); 3), the plasma membrane Ca2+-ATPase (IPM); and 4), the outward Na+ current (INa). The five Ca2+ fluxes responsible for controlling intracellular Ca2+ movement are 1), the mitochondrial Ca2+ uniporter (JMCU); 2), the mitochondrial Na+/Ca2+ exchanger (JNCX); 3), sarcoendoplasmic reticulum Ca2+-ATPase (JSERCA); 4), the IP3R Ca2+ flux (JIPR); and 5), the intercytoplasmic subspace Ca2+ flux (JS1S2). All of the components included in this model are introduced in the Model framework section. The equations describing the ionic conductances and governing the model-state variables are located in Appendix A, and all model parameter and initial-state variable values are given in Table 2.
FIGURE 2
FIGURE 2
High-powered ICC electron micrograph photos showing the ultrastructural features. Note the abundance of mitochondria (M) and endoplasmic reticulum (arrowheads) in close proximity to each other and the cell membrane. Figure reprinted with permission from the Annual Review of Physiology, Volume 68 © 2006 by Annual Reviews (www.annualreviews.org).
FIGURE 3
FIGURE 3
UP membrane depolarizations produced from model simulations. (A) A single UP oscillation. (B) UPs over multiple pacemaker cycles, illustrating the spontaneous rhythmicity of model pacemaker activity.
FIGURE 4
FIGURE 4
Intracellular ionic concentrations and IP3R open probability tracked over multiple pacemaker cycles. The plots displayed are (A) S1 [Ca2+], CS1, (B) S2 [Ca2+], CS2, (C) IP3R open probability, PIPR, (D) ER [Ca2+], CER, (E) mitochondrial [Ca2+], CMT, and (F) S1 [Na+], NS1. Note that logarithmic values are plotted for the CS2 (B) and PIPR (C) traces.
FIGURE 5
FIGURE 5
Plots showing the temporal relationship between the model SVs during the ER Ca2+ release phase of the UP oscillatory cycle. (A) The simultaneous increase in CS2 and PIPR leads to (B) initiation of ER Ca2+ causing a sudden reduction in CER, which results in (C) a significant increase in CS2. (D) The significant increase in CS2 activates the MCU, causing mitochondrial Ca2+ accumulation. (E) Simultaneously, the SERCA pumps activate to replenish ER Ca2+ stores, hence causing a reduction in CS1. The depletion in CS1 activates INSCC, resulting in (F) a significant influx of Na+ into the pacemaker unit. Note that the SV on the left vertical axis is represented by the solid curve, and the SV on the right vertical axis by the dashed curve. Also note that logarithmic values are plotted for the CS2 (B) and PIPR (C) traces.
FIGURE 6
FIGURE 6
Schematic diagram of the pacemaking mechanism cycle as illustrated by the model response. (Step 1) Initial Ca2+ entry from the Vm-dependent inward Ca2+ current, ICa, which diffuses from S1 to S2. (Step 2) Sufficient Ca2+ entry into S2 raises the IP3R open probability to threshold and ER Ca2+ release occurs. (Step 3) The subsequent increase in CS2 activates the MCU, causing rapid mitochondrial Ca2+ accumulation. (Step 4) ER Ca2+ sequestration via the SERCA pumps to replenish ER Ca2+ stores. (Step 5) Activation of INSCC, caused by CS1 depletion from SERCA activation. The resulting Ca2+ and Na+ influx is responsible for the UP depolarization phase. (Step 6) Repolarization, caused by INa activation from increased NS1 levels, and CMT restitution, from JNCX, resets the pacemaker unit allowing the cycle to begin again.
FIGURE 7
FIGURE 7
Pacemaker unit cytosolic [Ca2+] oscillations around the ER Ca2+ release phase of the pacemaker cycle (A) and over multiple pacemaker cycles (B). Note that there is an increase in cytosolic [Ca2+] over each cycle. This is despite the fact that depletion of CS1 is required for the activation of pacemaker currents (INSCC) and CS1 makes up the bulk of cytosolic [Ca2+].
FIGURE 8
FIGURE 8
Intracellular ionic concentrations produced under simulated voltage-clamp conditions for (A) CS1, (B) CS2, (C) CER, (D) CMT, and (E) NS1. Simulations were performed for Vm = −80, −70, and −60 mV. The simulations show that depolarization causes a decrease in pacemaking frequency and a decrease in the magnitude of the intracellular ionic concentrations (the effect is opposite for hyperpolarization). Note that logarithmic values are plotted for the CS2 trace (B).
FIGURE 9
FIGURE 9
Numerical simulations showing the short-term (AC) and long-term (DF) effects of mitochondrial inhibition on pacemaker activity. The bar above the traces in AC denotes MCU inhibition. UP depolarizations, which are present before MCU inhibition, are abolished after MCU block (A). This appears to be due to a build-up in CS2 (B) which prevents the IP3R from returning to a susceptible state (C). Long-term simulation, after pacemaker activity cessation, shows membrane hyperpolarization (D) caused by a transient increase in CS1 (E). The increase in CS1 is due to the emptying of mitochondrial Ca2+ stores over time (F). Note that logarithmic values are plotted for the CS2 (B) and PIPR (C) traces, and that the y axis on CS1 trace (E) is truncated at 0.121 μM.
FIGURE 10
FIGURE 10
Trace of the aggregate plasma membrane current, Iion, required to reproduce a UP depolarization using the UP representation of Edwards and Hirst (12) (A = 0.434 s, B = 0.077 s, 3HCm = 1). Note the two distinct phases of transmembrane ionic flux that comprise UP depolarizations: net inward ion flux and net outward ion flux.

References

    1. Szurszewski, J. H. (1987). Electrical basis for gastrointestinal motility. In Physiology of the Gastrointestinal Tract, 2nd ed. L. R. Johnson, editor. Raven Press, New York. 383–422.
    1. Tomita, T. (1981). Electrical activity (spikes and slow waves) in gastrointestinal smooth muscle. In Smooth Muscle: An Assessment of Current Knowledge. E. Bulbring, A. F. Brading, A. W. Jones, and T. Tomita, editors. University of Texas Press, Austin, TX. 127–156.
    1. Smith, T. K., J. B. Reed, and K. M. Sanders. 1987. Origin and propagation of electrical slow waves in circular muscle of canine proximal colon. Am. J. Physiol. 252:C215–C224. - PubMed
    1. Ward, S. M., A. J. Burns, S. Torihashi, and K. M. Sanders. 1994. Mutation of the proto-oncogene c-kit blocks development of interstitial cells and electrical rhythmicity in murine intestine. J. Physiol. 480:91–97. - PMC - PubMed
    1. Huizinga, J. D., L. Thuneberg, M. Kluppel, J. Malysz, H. B. Mikkelsen, and A. Bernstein. 1995. W/kit gene required for interstitial cells of Cajal and for intestinal pacemaker activity. Nature. 373:347–349. - PubMed

Publication types

MeSH terms

LinkOut - more resources