. 2008 Jul;95(1):176-85.
doi: 10.1529/biophysj.107.124768. Epub 2008 Mar 13.

Effects on membrane capacitance of steroids with antagonist properties at GABAA receptors

Affiliations

Effects on membrane capacitance of steroids with antagonist properties at GABAA receptors

Steven Mennerick et al. Biophys J. 2008 Jul.

Abstract

We investigated the electrophysiological signature of neuroactive steroid interactions with the plasma membrane. We found that charged, sulfated neuroactive steroids, those that exhibit noncompetitive antagonism of GABA(A) receptors, altered capacitive charge movement in response to voltage pulses in cells lacking GABA receptors. Uncharged steroids, some of which are potent enhancers of GABA(A) receptor activity, produced no alteration in membrane capacitance. We hypothesized that the charge movements might result from physical translocation of the charged steroid through the transmembrane voltage, as has been observed previously with several hydrophobic anions. However, the charge movements and relaxation time constants of capacitive currents did not exhibit the Boltzmann-type voltage dependence predicted by a single barrier model. Further, a fluorescently tagged analog of a sulfated neurosteroid altered membrane capacitance similar to the parent compound but produced no voltage-dependent fluorescence change, a result inconsistent with a strong change in the polar environment of the fluorophore during depolarization. These findings suggest that negatively charged sulfated steroids alter the plasma membrane capacitance without physical movement of the molecule through the electric field.


Figures
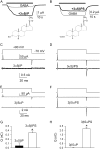
FIGURE 1
FIGURE 1
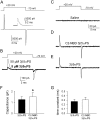
Effects on membrane properties of steroid potentiators and antagonists of GABAA receptor function. (A) In voltage-clamped oocytes (−70 mV) expressing the α1β2γ2L GABAA receptor subunit combination, GABA (4 μM) application for the period denoted by the horizontal bar generated an inward current (thin trace) that was potentiated by the co-application of 0.5 μM 3α5βP (thick trace). Mean potentiation in 3 cells was 5.7 ± 0.7-fold above the baseline GABA response. (B) In the same oocyte as A, the sulfated neurosteroid 3α5βPS (10 μM) antagonized the GABA response by ∼40%. The structures of the relevant steroids are shown below the panels. In four cells the average inhibition was 38 ± 2%. (C–F) Steroid-induced capacitive current changes in an oocyte not expressing GABA receptors. Top traces in each panel represent the voltage protocol. Middle traces represent raw current responses to the pulse protocol; responses obtained in plain saline and in 50 μM of the indicated drug are superimposed. Bottom traces represent digital subtraction of the baseline trace from the drug trace. (C) In the bottom trace, the negligible current responses represent current attributable to 50 μM 3α5βP, because baseline currents to the same voltage pulse have been subtracted away. (D) The same experiment carried out using the sulfated neurosteroid (50 μM) showed that the drug induced significant changes in the transient current responses to voltage pulses. (E and F) The same protocol as that used in C and D, except with a pair of neurosteroids with different stereochemistry at carbons 3 and 5. (G and H) Summary of the charge integral obtained by integrating the transient current onsets in traces like those in C–F (n = 3–9 oocytes for each bar). Note that uncharged steroids (left bar of each pair) did not generate a significant alteration (p > 0.05 compared with 0 change) in capacitive charge movement but that sulfated steroids (right bar) did (p < 0.01 compared with 0 change). The 3β5α sulfated steroid (F and H) generated significantly larger alterations in capacitive currents than its diastereomer (D and G; *p < 0.05 sulfated versus unsulfated).
FIGURE 2
FIGURE 2
Estimates of capacitive change and conservation of charge in oocytes. (A) Raw, unsubtracted traces of the onset current in response to a 160 mV voltage pulse from −70 mV. The dotted trace shows the transient current response under baseline conditions (absence of drug). The solid trace shows the current response in the presence of 50 μM 3β5αPS. (B) Replot of the dotted trace (absence of steroid) from A showing a single exponential fit (solid line) superimposed on the relaxation of the transient, extrapolated to the onset of the voltage pulse to +90 mV. The shading under the fit represents the integral used to calculate total charge displaced. The inset shows the estimate of cell capacitance (total charge displaced, normalized to the amplitude of the voltage pulse) in the absence (black bar) and presence (white bar) of 3β5αPS. *p < 0.05, paired t-test, n = 11 oocytes. (C and D) The traces are superimposed subtractions (50 μM 3β5αPS minus baseline saline) showing the transient response to pulse onset (solid line) to +90 mV and offset (dotted line) on return to −70 mV. The offset responses have been inverted and superimposed for comparison with the onset responses. For long voltage pulses the charge observed on step back to −70 mV was larger than the charge at onset, but for short pulses charge was nearly completely conserved.
FIGURE 3
FIGURE 3
Concentration dependence of time constant (A), amplitude (B), and charge displacement (C) of transient onset currents. Estimates were obtained from subtraction currents. Subtracted relaxations were fit to a single exponential and extrapolated to the onset of the voltage pulse for estimates of amplitude and charge. Solid lines in B and C represent best fits of the concentration-response data to the Hill equation. n = 4 oocytes challenged with all four concentrations of 3β5αPS. (D) Lack of enantioselectivity of charge movements. Pregnenolone sulfate and its enantiomer were evaluated at 50 μM on the same oocyte. Drug minus baseline subtraction traces are shown (dotted lines) along with a portion of the exponential fit used to quantify drug-associated capacitive current amplitude (fit extrapolated to time zero), time constant, and total charge displacement. In this example, pregnenolone sulfate charge displacement was 1.84 nC and ent-pregnenolone sulfate charge displacement was 1.80 nC. Time constants were 234 μs and 232 μs, respectively.
FIGURE 4
FIGURE 4
Charge displacements and time constants lack voltage dependence. Measurements were made from subtracted onset currents in response to steps from −70 mV. (A) Drug-induced onset charge estimates showed nearly linear (solid circles, n = 5 oocytes), rather than sigmoidal (solid fit line), dependence on membrane potential. (B) The time constants of drug-induced current relaxations did not show the expected bell-shaped dependence on membrane potential. Estimates of charge and time constants were obtained from subtraction currents, which were fit with single exponential functions extrapolated to the instant of the voltage-pulse onset. The solid lines in A and B are fits to Eqs. 2 and 3, respectively. Fit parameters were β = 0.3 and Vh = 92 mV (A) and tmax = 1.03 ms, β = 0.12, and Vh = 0.0 mV (B). (C and D) Positive control experiment using oocytes exposed to tetraphenylborate (100 μM). The inset in C shows representative capacitive currents, with the first 600 μs of capacitive current blanked, showing tetraphenylborate-induced changes in the absence of fast, endogenous capacitive currents. Voltage pulses were from a holding potential of −30 mV and were made to voltages between −200 mV and + 200 mV in 20 mV increments. The solid circles in C represent slow charge displacements, isolated with bi-exponential fits to the total capacitive transients of four oocytes. The solid line is a fit to Eq. 3 with fit parameters of β = 0.7 and Vh = −78.7 mV. See Results for an interpretation of the negative Vh value. Time constants of the slow component of capacitive transients are plotted in D. The solid line is a fit to Eq. 3 with tmax = 35.6 ms, β = 0.6, and Vh = 0 mV.
FIGURE 5
FIGURE 5
Lack of voltage-dependent fluorescence change with a sulfated NBD-tagged analog. (A1 and A2) Fluorescence images obtained in the presence of 3 μM C2-NBD 3β5αPS at membrane potentials of −70 mV (left) and after 20 s at +40 mV (right). Voltage was controlled with a whole-cell patch pipette visible as a shadow on the right side of the image, through the aqueous fluorescence of the analog. Results are representative of six cells challenged with 1–6 μM C2-NBD 3β5αPS. (Bottom panels) Positive control using DiBAC4 (3) (0.5 μm) imaged under the same conditions as in the top panels. The fluorescence change was reversible on re-establishing a membrane potential of −70 mV (not shown). Scale bar represents 10 μm.
FIGURE 6
FIGURE 6
The NBD-tagged steroid C2-NBD 3β5αPS yields capacitance changes similar to the parent compound, 3β5αPS. (A) Raw current traces in normal saline obtained from an isolated HEK cell in response to a voltage pulse from −70 mV to +20 mV. The onset transient is shown at higher time resolution in the inset as dotted points. The gray line is a single-exponential fit, superimposed and extrapolated to the instant of the voltage change. The time constant of the transient relaxation was 102 μs. The good correspondence between fit and data is consistent with a representation of the cell as a single electrical compartment (31). (B) Subtracted traces obtained from a different cell exposed to 5 μM and 50 μM 3β5αPS. Transients in the presence of saline wash have been subtracted. (C and D) Subtraction currents from the cell in A. (C) Represents saline minus saline subtractions obtained under the same experimental conditions as with drug applications in D and E. (D) Represents subtraction of saline transients from transients obtained in the presence of 15 μM C2-NBD 3β5αPS. (E) Represents saline transients subtracted from transients obtained in the presence of 15 μM 3β5αPS. In the subtracted traces of C–E the first 50 μs of data at the onset and offset of the voltage pulse have been blanked to eliminate small, fast, capacitive changes resulting from bath level changes. The voltage protocol and calibration bars in C apply to C–E. (F and G) Summary (n = 8 HEK cells) of steroid-induced capacitance changes (F) and time constants of the capacitance changes (G) in HEK cells using the voltage protocol shown in A. Compounds were used at 15 μM. C2-NBD 3β5αP yielded a slightly but significantly higher change in capacitance than the parent steroid (p = 0.03). There was no difference in drug-induced relaxation time constant (p > 0.09).

Similar articles

Cited by

References

    1. Hosie, A. M., M. E. Wilkins, H. M. A. da Silva, and T. G. Smart. 2006. Endogenous neurosteroids regulate GABAA receptors via two discrete transmembrane sites. Nature. 444:486–489. - PubMed
    1. Shu, H. J., L. N. Eisenman, D. Jinadasa, D. F. Covey, C. F. Zorumski, and S. Mennerick. 2004. Slow actions of neuroactive steroids at GABAA receptors. J. Neurosci. 24:6667–6675. - PMC - PubMed
    1. Akk, G., H. J. Shu, C. Wang, J. H. Steinbach, C. F. Zorumski, D. F. Covey, and S. Mennerick. 2005. Neurosteroid access to the GABAA receptor. J. Neurosci. 25:11605–11613. - PMC - PubMed
    1. Akk, G., D. F. Covey, A. S. Evers, J. H. Steinbach, C. F. Zorumski, and S. Mennerick. 2007. Mechanisms of neurosteroid interactions with GABAA receptors. Pharmacol. Ther. 116:35–57. - PMC - PubMed
    1. Majewska, M. D., J. M. Mienville, and S. Vicini. 1988. Neurosteroid pregnenolone sulfate antagonizes electrophysiological responses to GABA in neurons. Neurosci. Lett. 90:279–284. - PubMed

Publication types

LinkOut - more resources