. 2008 Jul;95(1):352-65.
doi: 10.1529/biophysj.107.127431. Epub 2008 Mar 13.

Nonequilibrium single molecule protein folding in a coaxial mixer

Affiliations

Nonequilibrium single molecule protein folding in a coaxial mixer

Kambiz M Hamadani et al. Biophys J. 2008 Jul.

Abstract

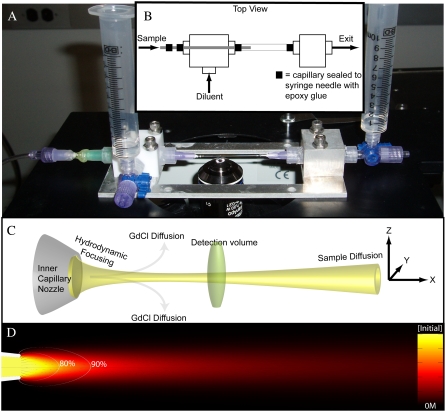
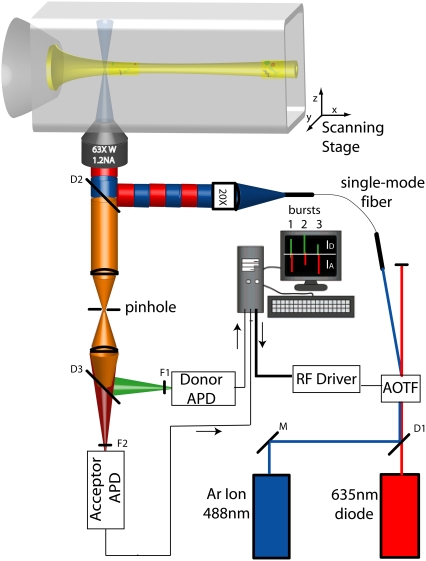
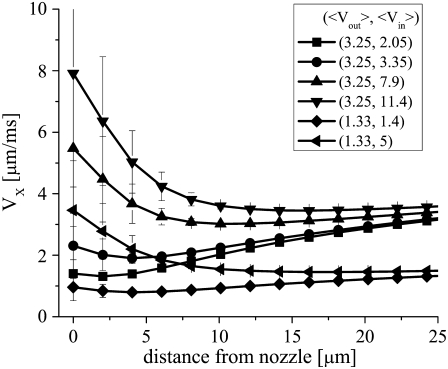
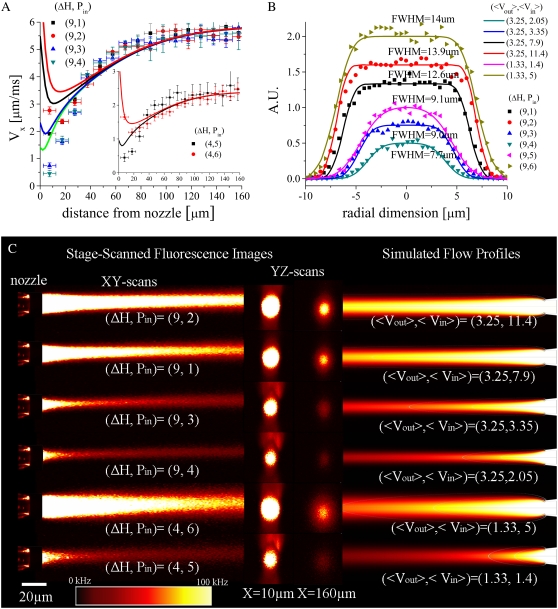
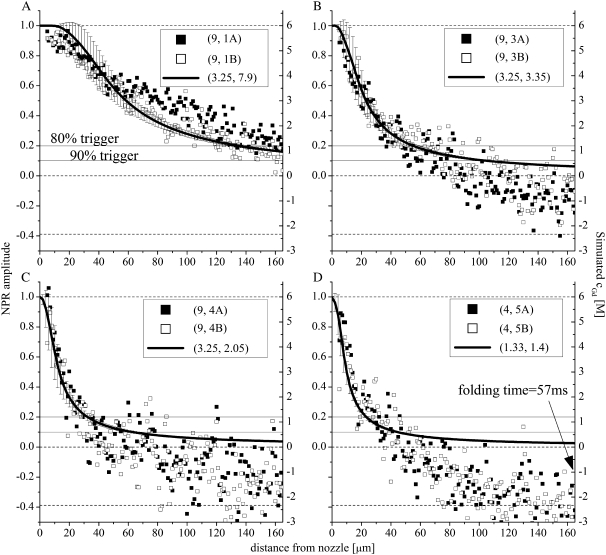
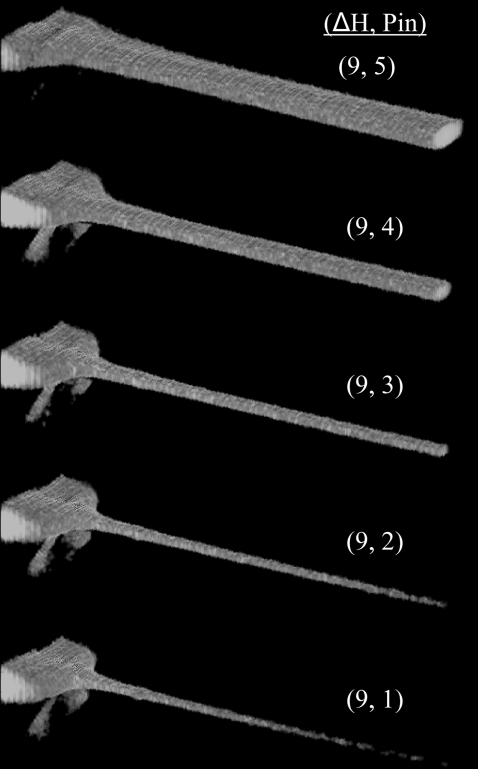
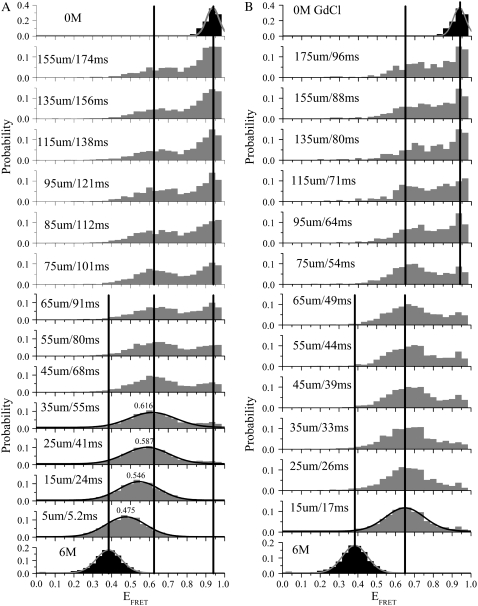
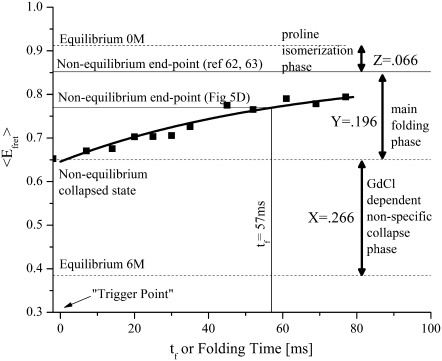
We have developed a continuous-flow mixing device suitable for monitoring bioconformational reactions at the single-molecule level with a response time of approximately 10 ms under single-molecule flow conditions. Its coaxial geometry allows three-dimensional hydrodynamic focusing of sample fluids to diffraction-limited dimensions where diffusional mixing is rapid and efficient. The capillary-based design enables rapid in-lab construction of mixers without the need for expensive lithography-based microfabrication facilities. In-line filtering of sample fluids using granulated silica particles virtually eliminates clogging and extends the lifetime of each device to many months. In this article, to determine both the distance-to-time transfer function and the instrument response function of the device we characterize its fluid flow and mixing properties using both fluorescence cross-correlation spectroscopy velocimetry and finite element fluid dynamics simulations. We then apply the mixer to single molecule FRET protein folding studies of Chymotrypsin Inhibitor protein 2. By transiently populating the unfolded state of Chymotrypsin Inhibitor Protein 2 (CI2) under nonequilibrium in vitro refolding conditions, we spatially and temporally resolve the denaturant-dependent nonspecific collapse of the unfolded state from the barrier-limited folding transition of CI2. Our results are consistent with previous CI2 mixing results that found evidence for a heterogeneous unfolded state consisting of cis- and trans-proline conformers.


Figures

FIGURE 1
FIGURE 1
(A) An image of the single molecule mixer. Diluent and exit fluid levels are both set to the first syringe marking (at 1 ml) so there is no bulk flow in the system (ΔH = 0). (B) A top view schematic illustrating the design and how fluids flow in and out of the mixing region through the two connector blocks. (C) A closeup of the mixing region illustrating hydrodynamic focusing of the sample stream, diffusion of GdCl away from the sample stream, single molecule detection as labeled sample molecules traverse the confocal detection volume, and the diffusion of sample molecules away from the axis of flow (x axis). (D) An x,y cross-section of a simulated flow profile with sample streamlines (solid lines), trigger-point contour lines (open lines), and the normalized protein sample concentration in a 40 × 200-μm field of view.
FIGURE 2
FIGURE 2
Microsecond ALEX optical setup using an acousto-optic tunable filter (AOTF). The 488-nm and 635-nm laser lines are combined with a dichroic mirror D1 and coupled into the AOTF. The negative first-order diffractions of the two laser lines are alternatively coupled into a single mode fiber. Light emanating out of the fiber is collimated (by a 20× objective) and coupled to the microscope through dichroic mirror D2. Florescence is collected, focused through a pinhole, and split into donor and acceptor signals before being filtered by emission filters F1 and F2 and refocused onto two avalanche photodiode detectors (APDs). Control of the AOTF RF signal and counting of photons is accomplished using homebuilt LabView data acquisition hardware and software.
FIGURE 3
FIGURE 3
Simulated axial fluid velocity profiles versus distance from the inner capillary nozzle aperture. The error bars are the standard deviation of the distribution of flow velocities present within 5 μm from the axis of flow at each position (i.e., a measure of the transverse inhomogeneity in the system). The simulation parameters (〈Vout〉 and 〈Vin〉 used to obtain each curve are given in the figure legend.
FIGURE 4
FIGURE 4
(A) Experimental (data points) versus simulated (lines) axial fluid velocity profiles. (B) Normalized experimental transverse sample stream fluorescence intensities at x ∼10 μm (data points) versus simulated sample concentration profiles (solid lines). To parameterize the simulations, 〈Vout〉 and 〈Vin〉 were consecutively modified so the terminal fluid velocity and sample stream FWHM near the nozzle, respectively, matched the corresponding experimentally determined values. (C) Stage-scanned confocal x,y and y,z sample fluorescence flow profiles and corresponding simulated sample concentration profiles for six different flow conditions. The dimensions of the images are 40 × 165 μm for the x,y images and 40 × 40 μm for the y,z images.
FIGURE 5
FIGURE 5
NPR amplitudes (solid and open data points, left axis) versus simulated denaturant concentration/response functions (solid lines and error bars, right axis) for four of the flow conditions shown in Fig. 4. (A) (〈Vout〉, 〈Vin〉) = (3.25, 7.9); (B) (〈Vout〉, 〈Vin〉) = (3.25, 3.35); (C) (〈Vout〉, 〈Vin〉) = (3.25, 2.05); and (D) (〈Vout〉, 〈Vin〉) = (1.33, 1.4). The solid horizontal lines indicate the 80% and 90% trigger-point contour lines. As 〈Vin〉 is increased, the stream widens, the trigger points move to distances further from the nozzle, and the standard deviation of the simulated denaturant concentration present within a 3 μm radius of the axis of flow at a given distance from the nozzle (error bars) increases. The dotted line at the NPR = −0.388 is the nonequilibrium endpoint NPR signal (at a folding time of 57 ms) obtained for the slowest flow conditions (D).
FIGURE 6
FIGURE 6
Three-dimensional rendering of laser-scanning confocal images of a 10 nM FITC-dextran (70 kDa) sample being hydrodynamically focused in one of the mixers (nozzle ID ∼9 μm). The optical axis goes into and to the right of the images. These images were passed through a nonlinear image filter (Leica Confor 2 median filter), diminishing low-intensity background signals which would otherwise obscure the sample stream. The flow conditions are given as the height difference between the entry and exit reservoirs (ΔH) and an arbitrary Pin number which has no correlation to the actual pressure applied to the inner capillary.
FIGURE 7
FIGURE 7
Nonequilibrium single molecule EFRET histograms of D-A-labeled CI2 collected at different distances/times and under two different single molecule flow conditions. In panel A, the flow is slower (〈Vout〉 = 0.65 μm/ms) and less focused—the resulting dead time is longer (∼53 ms for the 90% trigger point contour) and the dynamic range extends to 174 ms. In panel B, the flow is faster (〈Vout〉 = 1.4 μm/ms) and more focused—the resulting dead time is shorter (∼19 ms) and the dynamic range is reduced to 96 ms. Each histogram has 30 bins. The vertical lines are a guide to the eye and indicate the means of 1), the initial equilibrium (solid histograms) distribution (in 6 M GdCl); 2), the nonequilibrium (shaded histograms) collapsed (〈EFRET〉 = 0.625–0.65) state; and 3), the endpoint folded state of CI2.
FIGURE 8
FIGURE 8
Ensemble averages of the single molecule histograms in Fig. 7 B are shown as a function of folding time. Single exponential fitting of the data assuming a 23% amplitude for the cis-proline fraction yields a τ1/2 of 43 ± 4 ms.

References

    1. Wolynes, P. G., J. N. Onuchic, and D. Thirumalai. 1995. Navigating the folding routes. Science. 267:1619–1620. - PubMed
    1. Oliveberg, M., and P. G. Wolynes. 2005. The experimental survey of protein-folding energy landscapes. Q. Rev. Biophys. 38:245–288. - PubMed
    1. Bilsel, O., and C. R. Matthews. 2006. Molecular dimensions and their distributions in early folding intermediates. Curr. Opin. Struct. Biol. 16:86–93. - PubMed
    1. Haas, E. 2005. The study of protein folding and dynamics by determination of intramolecular distance distributions and their fluctuations using ensemble and single-molecule FRET measurements. ChemPhysChem. 6:858–870. - PubMed
    1. Deniz, A. A., T. A. Laurence, G. S. Beligere, M. Dahan, A. B. Martin, D. S. Chemla, P. E. Dawson, P. G. Schultz, and S. Weiss. 2000. Single-molecule protein folding: diffusion fluorescence resonance energy transfer studies of the denaturation of chymotrypsin inhibitor 2. Proc. Natl. Acad. Sci. USA. 97:5179–5184. - PMC - PubMed

Publication types

LinkOut - more resources