. 2008 Jun;18(6):900-10.
doi: 10.1101/gr.070276.107. Epub 2008 Mar 13.

Genome-wide analysis of Fis binding in Escherichia coli indicates a causative role for A-/AT-tracts

Affiliations

Genome-wide analysis of Fis binding in Escherichia coli indicates a causative role for A-/AT-tracts

Byung-Kwan Cho et al. Genome Res. 2008 Jun.

Abstract

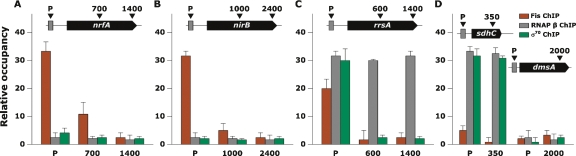
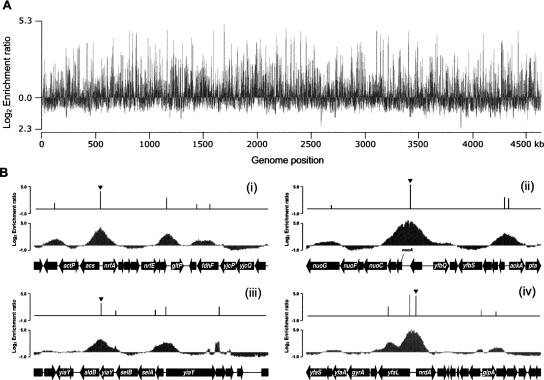
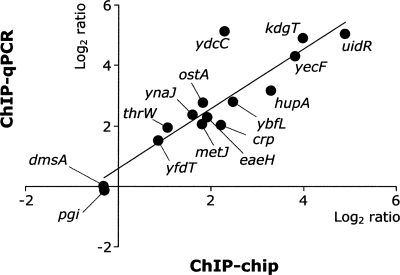
We determined the genome-wide distribution of the nucleoid-associated protein Fis in Escherichia coli using chromatin immunoprecipitation coupled with high-resolution whole genome-tiling microarrays. We identified 894 Fis-associated regions across the E. coli genome. A significant number of these binding sites were found within open reading frames (33%) and between divergently transcribed transcripts (5%). Analysis indicates that A-tracts and AT-tracts are an important signal for preferred Fis-binding sites, and that A(6)-tracts in particular constitute a high-affinity signal that dictates Fis phasing in stretches of DNA containing multiple and variably spaced A-tracts and AT-tracts. Furthermore, we find evidence for an average of two Fis-binding regions per supercoiling domain in the chromosome of exponentially growing cells. Transcriptome analysis shows that approximately 21% of genes are affected by the deletion of fis; however, the changes in magnitude are small. To address the differential Fis bindings under growth environment perturbation, ChIP-chip analysis was performed using cells grown under aerobic and anaerobic growth conditions. Interestingly, the Fis-binding regions are almost identical in aerobic and anaerobic growth conditions-indicating that the E. coli genome topology mediated by Fis is superficially identical in the two conditions. These novel results provide new insight into how Fis modulates DNA topology at a genome scale and thus advance our understanding of the architectural bases of the E. coli nucleoid.


Figures

Figure 1.
Figure 1.
Association of Fis with promoter regions of nrfA, sdhC, dmsA, nirB, and rrsA in mid-log growth phase under aerobic growth conditions. Relative occupancy on Y-axis represents the ratio of the immunoprecipitated DNA with and without antibodies using quantitative PCR. (A) In mid-log growth phase, Fis is present at the promoter region of nrfA, while the RNAP β levels remain at background levels. (B,C) Fis ChIP shows high occupancies at the promoter regions of nirB and rrsA. Owing to the transcriptional repression of the nirB gene under the conditions, RNAP β levels remain at background levels across the gene. However, rrsA is highly expressed in rapidly growing cells, so the RNAP β occupancy plateaus at the high level across the gene. (D) Fis is not associated with the promoter regions of sdhC and dmsA. RNAP β levels are high at the promoter and ORF regions of sdhC but are not present at the promoter regions of dmsA.
Figure 2.
Figure 2.
Genome-wide mapping of Fis-binding regions in E. coli. (A) An overview of Fis-binding profiles across the E. coli chromosome at exponential state under aerobic growth conditions. The log2 enrichment ratio on the Y-axis was calculated from Cy5 (IP DNA) and Cy3 (mock IP DNA) signal intensity of each probe and plotted against each location on the 4.64-Mb E. coli chromosome on the X-axis. (B) Determination of genuine Fis-binding peaks on the selected regions. Promoter region of (i) nrfA, (ii) nuoA, (iii) aldB, and (iv) nrdA are occupied by Fis at exponential state under aerobic growth conditions. The peak height of the identified Fis-binding peak is the log2 enrichment ratio calculated from Cy5 (IP DNA) and Cy3 (mock IP DNA) signal intensity of the probe corresponding to the identified peak.
Figure 3.
Figure 3.
Verification of ChIP-chip results by real-time quantitative PCR. Thirteen Fis-binding regions were randomly selected from the list of the identified Fis-binding regions. The promoter regions of dmsA and pgi were selected as control regions.
Figure 4.
Figure 4.
Properties of Fis-binding regions. (A) Classification of Fis-binding regions based on the binding patterns. (i) Fis bound near the promoter of brnQ is a member of the IG1 class, which encompasses Fis bound near promoter regions of the currently annotated genes. (ii) Fis bound between hemN and glnG is a member of the IG2 class, which encompasses Fis bound within the region of two divergently transcribed genes. (iii) Fis bound within the nusA gene is a member of the ORF class, which binds within the open reading frame of annotated genes. (B) Distribution of Fis binding between the three classes. (C) Many of the Fis-binding regions (IG1, IG2, and ORF) are also occupied by RNAP and σ70.
Figure 5.
Figure 5.
A histogram of the lengths of the intervals between Fis-binding sites identified by ChIP-chip experiments.
Figure 6.
Figure 6.
The most significant non-palindromic (npFis) and palindromic (pFis) motifs found in the chromosomal sequence regions under the Fis ChIp-chip peaks with log ratios ≥ 2. (Motifs estimated using different conservativeness levels are very similar; see Supplemental Figure 3.) The information content, significance value, and number of sites used to estimate the motif are displayed underneath each motif.
Figure 7.
Figure 7.
Receiver Operator Characteristic plots evaluating how well the npFis and pFis motifs from Figure 6 and the previously established Fis motif (Hengen et al. 1997) discriminated all (log ratio ≥ 1) Fis-peak-associated chromosomal sequences from random chromosomal sequences. The plotted curves are the average of 20 discrimination experiments that used different random chromosomal sequence sets.
Figure 8.
Figure 8.
Histogram of the separation distances between match start sites in the Fis peak regions for the npFis (top) and pFis (middle) motifs. Distances are weighted by the motif match score (Ri value) for each instance when the motif defines a separation distance. The vertical bars indicate the motif separation distances that place the A-tracts in the core of the npFis and pFis motifs (beginning at position 6 in Fig. 6) in perfect helical register (assuming 10.6 bp/helical turn in B-DNA). (Bottom panel) The subtractive difference of the top and middle histograms.

Similar articles

Cited by

References

    1. Augustin L.B., Jacobson B.A., Fuchs J.A., Jacobson B.A., Fuchs J.A., Fuchs J.A. Escherichia coli Fis and DnaA proteins bind specifically to the nrd promoter region and affect expression of an nrd-lac fusion. J. Bacteriol. 1994;176:378–387. - PMC - PubMed
    1. Azam T.A., Iwata A., Nishimura A., Ueda S., Ishihama A., Iwata A., Nishimura A., Ueda S., Ishihama A., Nishimura A., Ueda S., Ishihama A., Ueda S., Ishihama A., Ishihama A. Growth phase-dependent variation in protein composition of the Escherichia coli nucleoid. J. Bacteriol. 1999;181:6361–6370. - PMC - PubMed
    1. Azam T.A., Hiraga S., Ishihama A., Hiraga S., Ishihama A., Ishihama A. Two types of localization of the DNA-binding proteins within the Escherichia coli nucleoid. Genes Cells. 2000;5:613–626. - PubMed
    1. Bailey T.L., Elkan C., Elkan C. Fitting a mixture model by expectation maximization to discover motifs in biopolymers. Proc. Int. Conf. Intell. Syst. Mol. Biol. 1994;2:28–36. - PubMed
    1. Ball C.A., Osuna R., Ferguson K.C., Johnson R.C., Osuna R., Ferguson K.C., Johnson R.C., Ferguson K.C., Johnson R.C., Johnson R.C. Dramatic changes in Fis levels upon nutrient upshift in Escherichia coli. J. Bacteriol. 1992;174:8043–8056. - PMC - PubMed

Publication types

MeSH terms