. 2008 Apr 17;3(4):245-52.
doi: 10.1016/j.chom.2008.03.001. Epub 2008 Mar 13.

The interferon-induced protein BST-2 restricts HIV-1 release and is downregulated from the cell surface by the viral Vpu protein

Affiliations

The interferon-induced protein BST-2 restricts HIV-1 release and is downregulated from the cell surface by the viral Vpu protein

Nanette Van Damme et al. Cell Host Microbe. .

Abstract

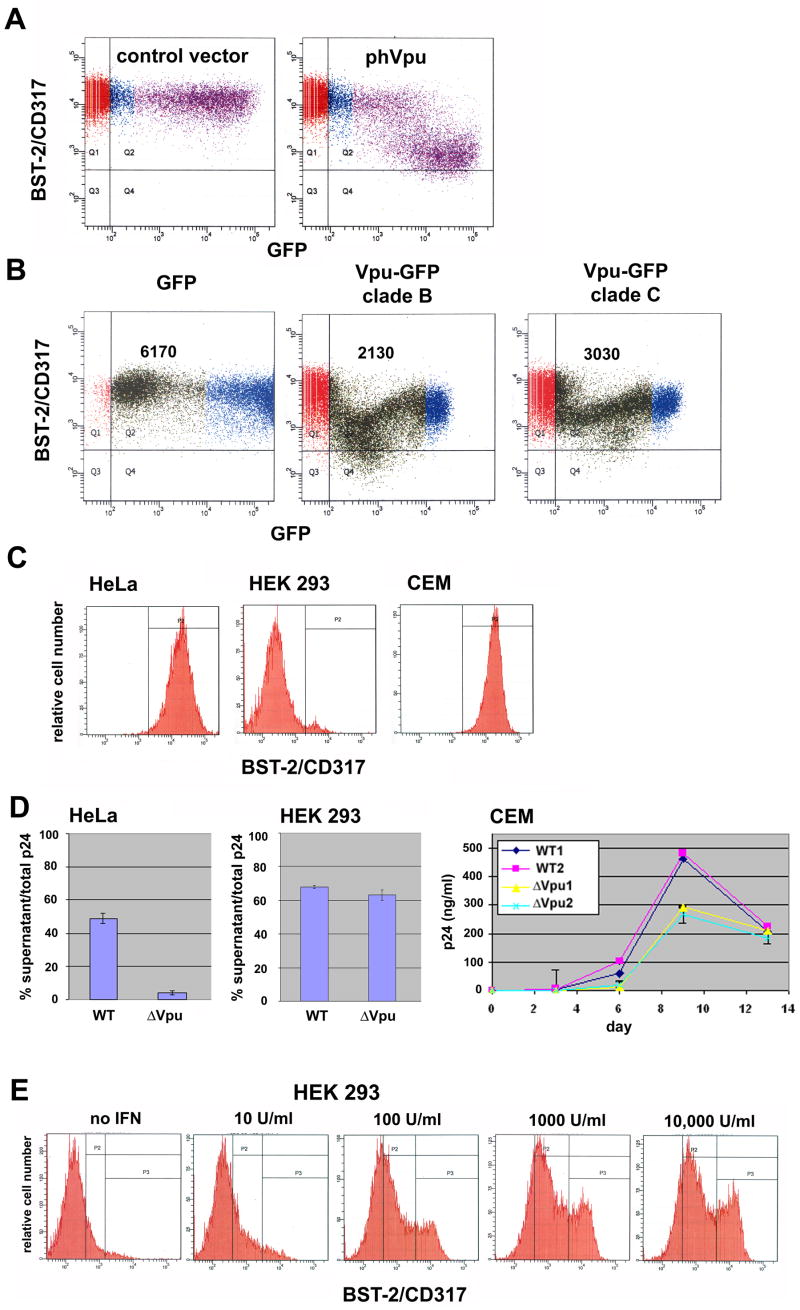
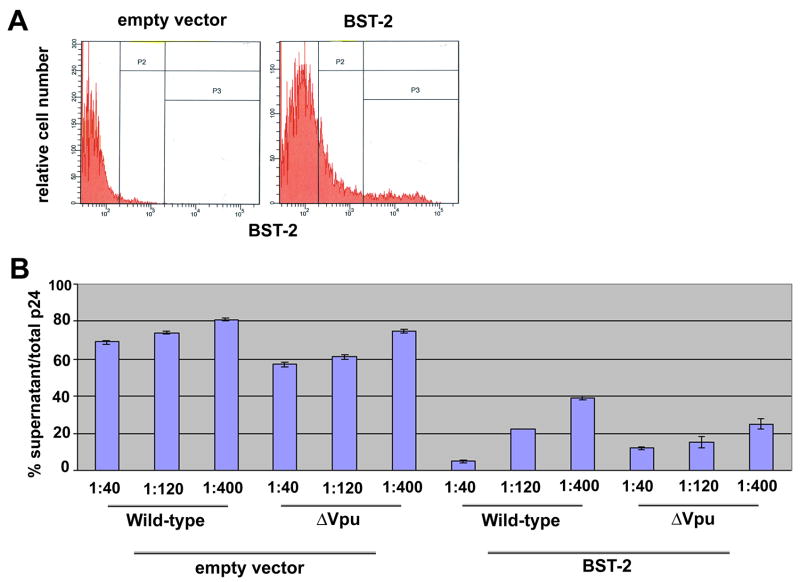
The HIV-1 accessory protein Vpu counteracts a host factor that restricts virion release from infected cells. Here we show that the interferon-induced cellular protein BST-2/HM1.24/CD317 is such a factor. BST-2 is downregulated from the cell surface by Vpu, and BST-2 is specifically expressed in cells that support the vpu phenotype. Exogenous expression of BST-2 inhibits HIV-1 virion release, while suppression of BST-2 relieves the requirement for Vpu. Downregulation of BST-2 requires both the transmembrane/ion channel domain and conserved serines in the cytoplasmic domain of Vpu. Endogenous BST-2 colocalizes with the HIV-1 structural protein Gag in endosomes and at the plasma membrane, suggesting that BST-2 traps virions within and on infected cells. The unusual structure of BST-2, which includes a transmembrane domain and a lumenal GPI anchor, may allow it to retain nascent enveloped virions on cellular membranes, providing a mechanism of viral restriction counteracted by a specific viral accessory protein.


Figures

Figure 1
Figure 1. BST-2/CD317 is down-regulated from the cell surface by HIV-1 Vpu; it is expressed constitutively in a cell-type-specific manner that correlates with the virology of Vpu, and its expression is induced by interferon-α
A) HeLa cells were transfected to express transiently either no viral protein (“control vector”) or a codon-optimized version of HIV-1NL4-3 Vpu (“phVpu”) along with GFP encoded on a separate plasmid, then stained the next day for surface BST-2/CD317 and analyzed by two-color flow cytometry. B) HeLa cells were transfected to express transiently GFP fusion proteins containing N-terminal Vpu of clade BHXB-2 or clade C, then stained the next day for surface BST-2/CD317 and analyzed by two-color flow cytometry. Numbers within each panel are the mean fluorescence intensities of cell surface BST-2 for the low- to mid-GFP positive cells (green). Note that the GFP moiety appeared to interfere with the activity of Vpu at high levels of expression. C) Cell surface expression of BST-2 in HeLa cells (clone P4.R5), HEK 293 cells, and CEM T lymphoblastoid cells measured using flow cytometry. D) Virologic effects of Vpu in the different host cells. Left two panels: percent p24 capsid secretion measured as the fraction of the total p24 capsid antigen produced by cultures of cells transfected with full length viral genomes that was secreted into the media. Right panel: growth curve of wild-type (“WT”) versus vpu-negative (“ΔVpu”) virus during spreading infection in CEM T cells. “1 and “2” indicate independently infected cultures. Error bars are the standard deviation. The difference between the concentrations of p24 antigen in the media of cultures infected with wild-type or ΔVpu at nine days after inoculation was significant (p=0.001 by t-test). E) Induction of BST-2 expression at the surface of HEK 293 cells by treatment with IFN-α. Cells were treated overnight with the indicated concentrations of interferon then analyzed by flow cytometry. In panels A-C, horizontal and vertical lines indicate gates set using either GFP-negative cells or a primary antibody isotype control for BST-2; colors are arbitrary and distinguish GFP-negative, -low positive, and -high positive cells. In panel E, the leftmost vertical line is the gate set using an antibody isotype control.
Figure 2
Figure 2. Exogenous expression of BST-2 in HEK 293 cells inhibits virion-release
A) HEK 293 cells were transfected to express either no protein (“empty vector”) or BST-2 (“BST-2”) and analyzed by flow cytometry for surface BST-2; 1.6 μg of DNA was used in each transfection. The leftmost vertical line is the gate set using an antibody isotype control. B) HEK 293 cells were transfected to express transiently the wild-type and vpu-negative HIV-1 genomes together with either no BST-2 (“empty vector”) or BST-2. Ratios are the relative amounts of plasmids by weight (empty vector or BST-2 vector: proviral (HIV-1) vector; total DNA was 1.6 μg in each transfection. The following day, the fraction of the total p24 capsid antigen produced that was secreted into the media was measured.
Figure 3
Figure 3. Reduction of constitutive BST-2-expression in HeLa cells decreases the virologic phenotype of vpu
A) HeLa cells were transfected to express transiently either no short-hairpin (sh) RNA (“empty vector”) or various shRNAs targeting different sequences in BST-2 mRNA (“TI-1”, “TI-3”, or “TI–4”), along with GFP encoded on a separate plasmid, then stained three days later for surface BST-2/CD317 and analyzed by two-color flow cytometry. Horizontal and vertical lines indicate gates set using either GFP-negative cells or a primary antibody isotype control for BST-2; colors are arbitrary and distinguish GFP-negative, -low positive, and -high positive cells. Total DNA in each transfection was 1.6 μg, 1.4 of which was the shRNA expression vector. B) HeLa cells were transfected to express either no shRNA or shRNAs TI-1, -3, -4, or an equimolar mixture of TI-1, -3, and –4, along with wild-type or vpu-negative full length viral DNA at a weight ratio of 2:1:: shRNA-vector: proviral plasmid. A CXCR4 receptor blocker (AMD3100) was used to limit viral production to the initially transfected cells, and the fraction of the total p24 capsid antigen produced that was secreted into the media was measured two days later.
Figure 4
Figure 4. Vpu-mediated down-regulation of BST-2 in the context of the complete HIV-1 genome requires the Vpu transmembrane domain and conserved serines in the cytoplasmic domain but is not prevented by inhibition of the proteasome
A) HeLa cells were transfected to express complete HIV-1 genomes, either wild-type (“WT”), vpu-negative (“ΔVpu”), a mutant encoding a Vpu protein whose transmembrane domain is scrambled (“VpuRD”), or a mutant in which serines 52 and 56 in the Vpu cytoplasmic domain are replaced by alanines (“Vpu2/6”), in each case along with GFP encoded on a separate plasmid. The cells were stained the next day for surface BST-2 and analyzed by two-color flow cytometry. B) HeLa cells were transfected with the indicated proviral genomes, and the fraction of the total p24 capsid antigen produced that was secreted into the media was measured one day later. C) HeLa cells were transfected to express transiently either no viral protein (“mock”) or a codon-optimized version of HIV-1NL4-3 Vpu along with GFP encoded on a separate plasmid. The next day, cells were either treated for five hours with 25 μM MG-132 (an inhibitor of the proteasome) or left untreated, then stained for surface BST-2 and analyzed by two-color flow cytometry. In panels A and C, horizontal and vertical lines indicate gates set using either GFP-negative cells or a primary antibody isotype control for BST-2; colors are arbitrary and distinguish GFP-negative, -low positive, and -high positive cells.
Figure 5
Figure 5. BST-2 co-localizes with Vpu
HeLa cells were transfected to express transiently either the wild-type or VpuRD viral genomes. The next day, the cells were stained by indirect immunofluorescence using antibodies to BST-2 and Vpu. Images were obtained using a spinning disc confocal microscope and processed using a deconvolution algorithm; single planes are shown. Insets show the boxed regions indicated in the “merge”panels. Vpu: green; BST-2: red. Scale bars are 10 microns.
Figure 6
Figure 6. BST-2 co-localizes with HIV-1 Gag (p17/p55) both along the plasma membrane and in endosomes
A) HeLa cells were transfected to express transiently either the wild-type or vpu-negative viral genome, along with GFP encoded on a separate plasmid. The next day, the cells were stained by indirect immunofluorescence using antibodies to BST-2 and HIV-1 Gag (p17/p55). Images were obtained using a spinning disc confocal microscope and processed using a deconvolution algorithm; single planes are shown. Insets show the boxed regions indicated in the “merge”panels. GFP: green; BST-2: red; p17/p55 Gag: blue. B) HEK 293 cells were transfected to express transiently either the wild-type or vpu-negative viral genome along with BST-2 encoded on a separate plasmid; the ratio of BST-2-expression plasmid: proviral plasmid was 1:4 by weight. The next day, the cells were stained by indirect immunofluorescence using antibodies to BST-2 and HIV-1 Gag (p17/p55); images were obtained as described above. p17/p55 Gag: green; BST-2: red. Scale bars in all panels are 10 microns.
Figure 7
Figure 7. BST-2 retains virus-like particles (VLPs) at the cell surface
HEK 293 cells (a–d) or HT1080 cells (e–h) were transfected to express transiently a provirus lacking intact vpu, vpr, vif, env and nef genes, along with either a vector expressing no BST-2 (a and b; e and f) or BST-2 (c and d; g and h). The proviral plasmid also encoded the fluorescent protein TdTomato, enabling assessment of the efficiency with which individual cells were transfected by fluorescence microscopy (insets), before visualization by SEM. Scales bars are 2 microns.

References

    1. Adachi A, Gendelman HE, Koenig S, Folks T, Willey R, Rabson A, Martin MA. Production of acquired immunodeficiency syndrome-associated retrovirus in human and non-human cells transfected with an infectious molecular clone. J Virol. 1986;59:284–291. - PMC - PubMed
    1. Aloia RC, Tian H, Jensen FC. Lipid composition and fluidity of the human immunodeficiency virus envelope and host cell plasma membranes. Proc Natl Acad Sci USA. 1993;90:5181–5185. - PMC - PubMed
    1. Bartee E, McCormack A, Fruh K. Quantitative membrane proteomics reveals new cellular targets of viral immune modulators. PLoS Pathog. 2006;2:e107. - PMC - PubMed
    1. Blasius AL, Giurisato E, Cella M, Schreiber RD, Shaw AS, Colonna M. Bone marrow stromal cell antigen 2 is a specific marker of type I IFN-producing cells in the naive mouse, but a promiscuous cell surface antigen following IFN stimulation. J Immunol. 2006;177:3260–3265. - PubMed
    1. Clavel F, Charneau P. Fusion from without directed by human immunodeficiency virus particles. J Virol. 1994;68:1179–1185. - PMC - PubMed

Publication types

MeSH terms

Substances