Review
. 2008 May 1;40(4):1436-59.
doi: 10.1016/j.neuroimage.2007.12.051. Epub 2008 Jan 11.

The micro-architecture of the cerebral cortex: functional neuroimaging models and metabolism

Affiliations
Review

The micro-architecture of the cerebral cortex: functional neuroimaging models and metabolism

Jorge J Riera et al. Neuroimage. .

Abstract

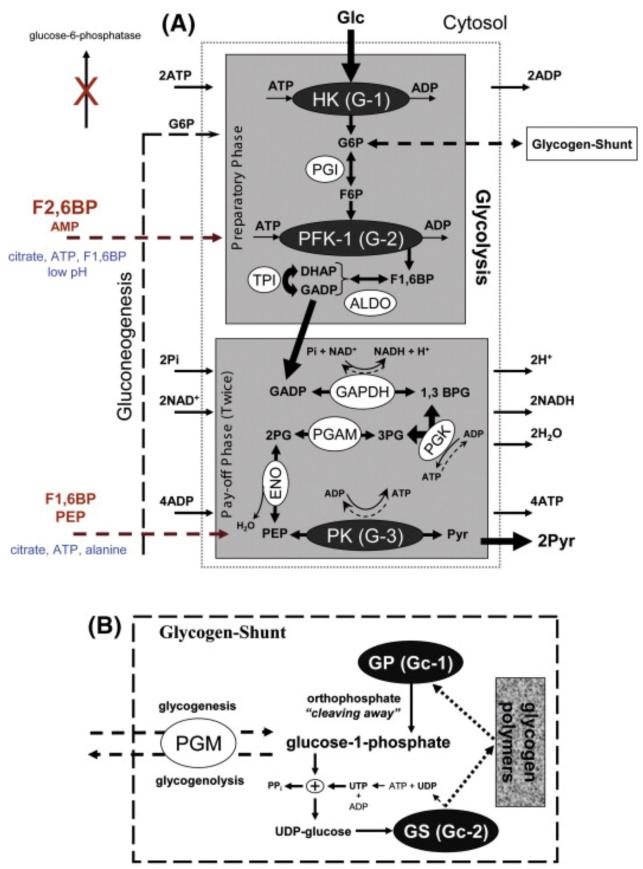
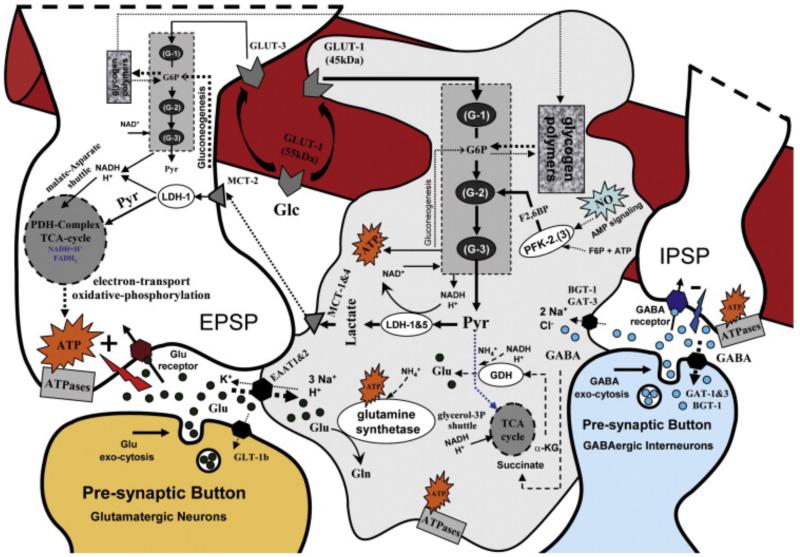
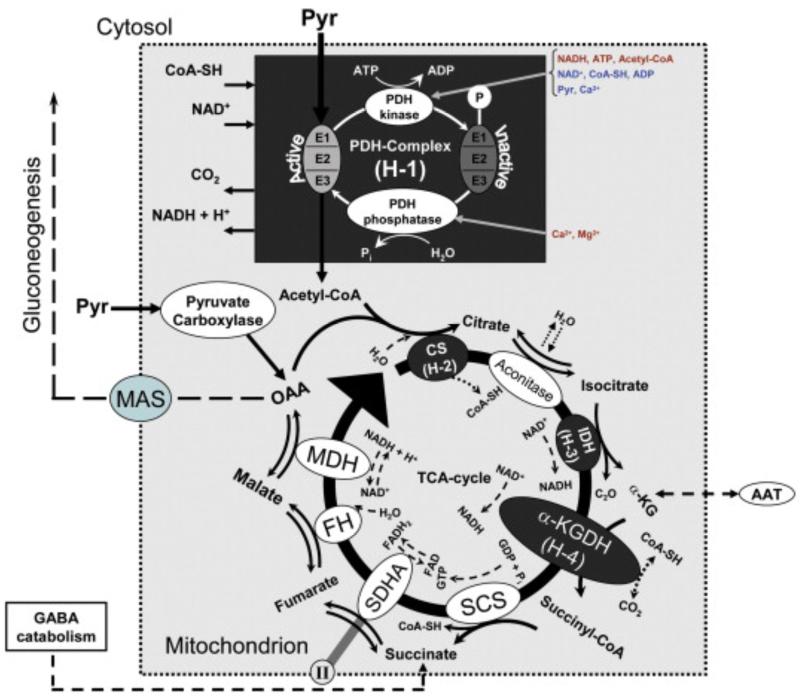
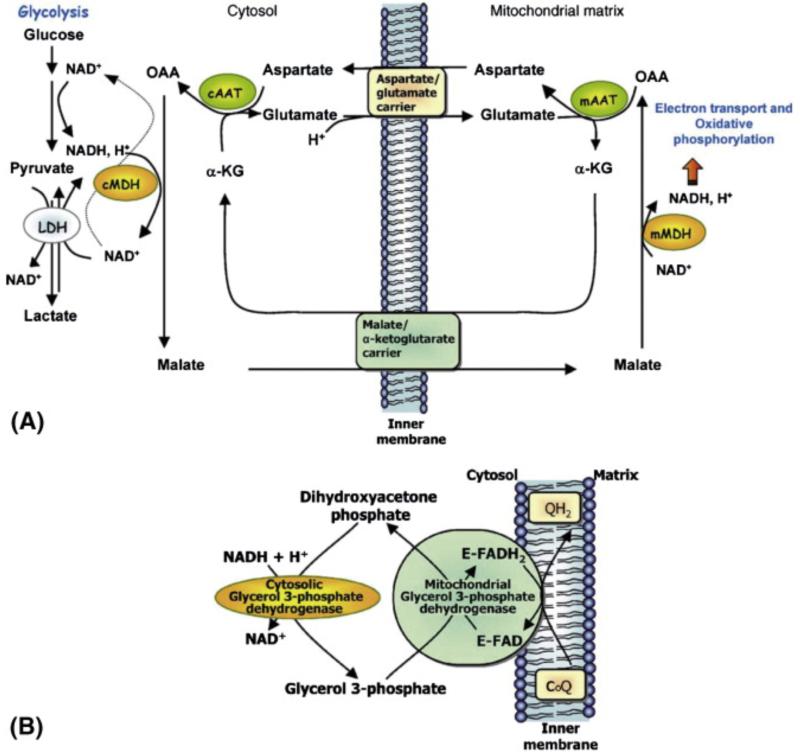
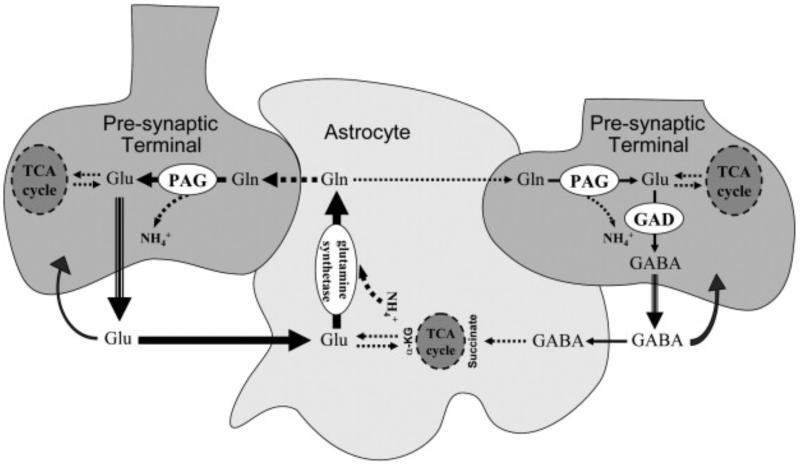
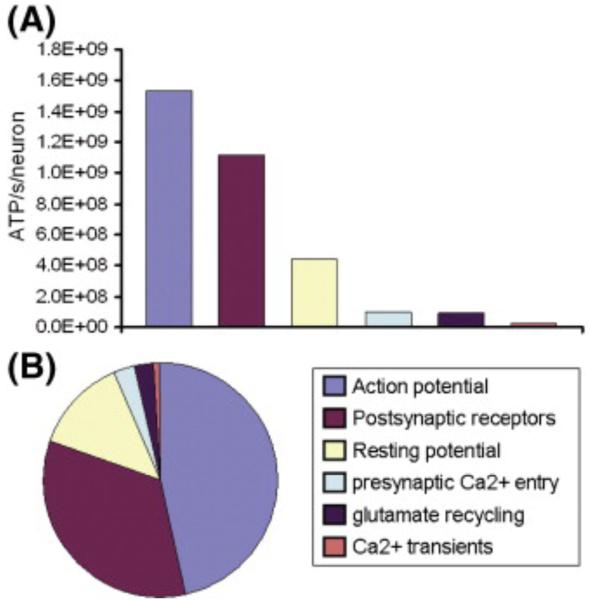
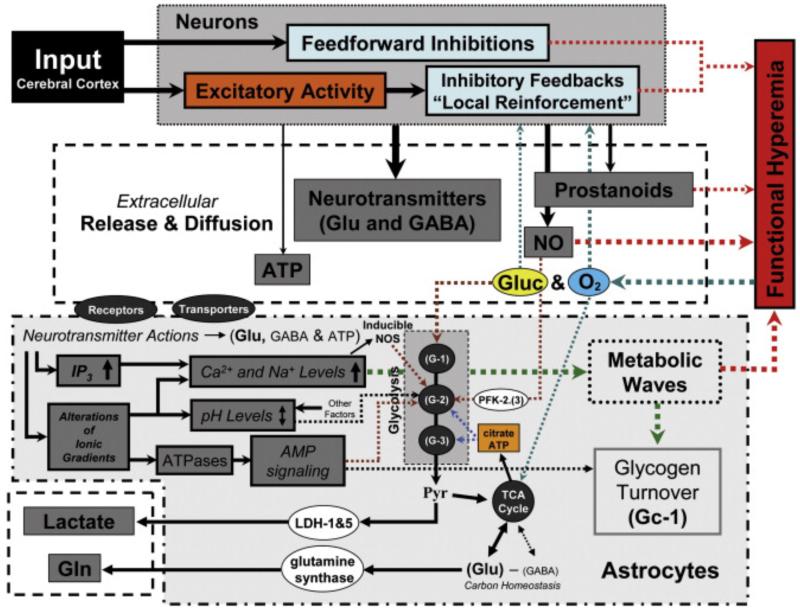
In order to interpret/integrate data obtained with different functional neuroimaging modalities (e.g. fMRI, EEG/MEG, PET/SPECT, fNIRS), forward-generative models of a diversity of brain mechanisms at the mesoscopic level are considered necessary. For the cerebral cortex, the brain structure with possibly the most relevance for functional neuroimaging, a variety of such biophysical models has been proposed over the last decade. The development of technological tools to investigate in vitro the physiological, anatomical and biochemical principles at the microscopic scale in comparative studies formed the basis for such theoretical progresses. However, with the most recent introduction of systems to record electrical (e.g. miniaturized probes chronically/acutely implantable in the brain), optical (e.g. two-photon laser scanning microscopy) and atomic nuclear spectral (e.g. nuclear magnetic resonance spectroscopy) signals using living laboratory animals, the field is receiving even greater attention. Major advances have been achieved by combining such sophisticated recording systems with new experimental strategies (e.g. transgenic/knock-out animals, high resolution stereotaxic manipulation systems for probe-guidance and cellular-scale chemical-delivery). Theoreticians may now be encouraged to re-consider previously formulated mesoscopic level models in order to incorporate important findings recently made at the microscopic scale. In this series of reviews, we summarize the background at the microscopic scale, which we suggest will constitute the foundations for upcoming representations at the mesoscopic level. In this first part, we focus our attention on the nerve ending particles in order to summarize basic principles and mechanisms underlying cellular metabolism in the cerebral cortex. It will be followed by two parts highlighting major features in its organization/working-principles to regulate both cerebral blood circulation and neuronal activity, respectively. Contemporary theoretical models for functional neuroimaging will be revised in the fourth part, with particular emphasis in their applications, advantages/limitations and future prospects.


Figures

Fig. 1
Fig. 1
A) Diagram of the preparatory and pay-off phases in glycolysis. The preparatory phase comprises four steps: a first phosphorylation [enzyme (HK), substrates (Glc, ATP), products (G6P, ADP), comments (a-it is the control point G-1, b-HK isozymes have direct access to mitochondrial ATP through specific binding to porins)], an isomerase reaction [enzyme (PGI), substrate (G6P), product (F6P), comment (it is a reversible and not normally favorable reaction driven by the concentration of F6P)], a second phosphorylation [enzyme (PFK-1), substrates (F6P, ATP), products (F1,6BP, ADP), comments (a-it is the control point G-2, the most important in glycolysis, b-during gluconeogenesis, a pathway crucial in developing brain, the reverse conversion must be performed by fructose 1,6 bisphosphatase)], an aldol reaction [enzyme (ALDO), substrate (F1,6BP), products (DHAP, GADP), comment (DHAP and GADP are rapidly and reversibly interconverted by TPI, a step essential to produce energy efficiently)]. The pay-off phase comprises five steps: a redox reaction [enzyme (GAPDH), substrates (GADP, NAD+, Pi), products (1,3BPG, NADH, H+), comment (the highly exergonic oxidation of GADP drives the endergonic transferring of Pi to an intermediate to finally form 1,3BPG, a product with high phosphoryl-transfer potential)], a first substrate-level phosphorylation [enzyme (PGK), substrates (1,3BPG, ADP), products (3PG, ATP), comment (it is the break-even point in glycolysis)], a mutase reaction [enzyme (PGAM), substrate (3PG), product (2PG), comment (a mutase does not change the oxidation state of the carbons in the compound)], a hydration [enzyme (ENO), substrates (2PG), product (PEP, H2O), comment (there are several enolase isozymes in humans)], a second substrate-level phosphorylation [enzyme (PK), substrates (PEP, ADP), products (Pyr, ATP), comment (it is the control point G-3)]. The negative and positive allosteric effectors are highlighted in blue and orange, respectively. B) The glycogen shunt hypothesis. Glycogenesis: The PGM, an isomerase, synthezises glucose-1-phosphate from G6P. The enzyme GS is responsible for the synthesis of glycogen polymers. This pathway utilizes UDP-glucose as the activated Glc donor. Glycogenolysis: Phosphorolysis by enzyme GP is the cleaving away of a bond by orthophosphate, and thus degradation of glycogen polymers to glucose-1-phosphate; which can then be isomerized to G6P by PGM iso-energetically. Abbreviations: ALDO → fructose 1,6 bisphosphate aldolase, DHAP → dihydroxyacetone phosphate, TPI → triose-phosphate isomerase, GAPDH → glyceraldehyde phosphate dehydrogenase, NAD+ → nicotinamide adenine dinucleotide (oxidized form), 1,3BPG → 1,3-bisphosphoglycerate, 3PG → 3-phosphoglycerate, 2PG → 2-phosphoglycerate, PGAM → phosphoglycerate mutase, ENO → enolase.
Fig. 2
Fig. 2
Schematic representation of the glycolysis/glycogen-shunt (grey even/mosaic squares) and TCA-cycle (grey circles) pathways in nerve ending particles and astrocytes, as well as the respective single/multi cellular compartmentalization for the metabolite/ion flows (arrows). The impact of each pathway in neurons and astrocytes is symbolized by the size of the squares/circles. Glc is continuously delivered from capillaries (red) to the extracellular milieu through GLUT-1 (55 kDa). Cells take up extracellular Glc through GLUT-1, 45 kDa form (astrocytes) and GLUT-3 (neurons). In different proportions, Pyr and ATP are produced from glycolysis in both cell types. The astrocytes-neuron lactate shuttle is facilitated by the differential presence of LDH-1 and LDH-1&5 in neurons and astrocytes, respectively. This shuttle may be favored by the existence of monocarboxylate transporters MCT-2 and MCT-1&4 in neurons and astrocytes, respectively. NO may catalyze the glycolysis in astrocytes through PFK-2.(3). Neurotransmitters [e.g. glutamate (Glu), GABA] released into the synaptic cleft in the course of pre-synaptic neuronal activity will freely diffuse toward neuronal postsynaptic buttons and nearby astrocytic processes. They will cause either excitatory (EPSP) or inhibitory (IPSP) postsynaptic potentials by receptor-specific flows of ions in the postsynaptic neurons. After the genesis of EPSP/IPSP, ionic gradients will be reestablished by way of transmembrane ATPases, which consume large amounts of ATP. In the postsynaptic button, the required ATP is produced from Pyr through the TCA-cycle and electron-transport/oxidative-phosphorylation pathways. The major portion of the lasting extracellular glutamate is promptly taken up into astrocytes via EAAT1&2, although pre- and post-synaptic terminals of glutamatergic neurons could also take up smaller amounts of extracellular glutamate via GLT1-b and EAAT3, respectively. In contrast, the pre-synaptic terminals of GABAergic interneurons take up most of the extracellular GABA via transporters GAT-1&3 and BGT-1. However, it is known that a small fraction is taken up by astrocytes via transporters GAT-3 and BGT-1 to contribute to the overall carbon and ammonia homeostasis in the nerve ending. GABA inside the astrocytes could be catabolized to succinate to enter the TCA-cycle. The transferred carbon will flow out of the TCA-cycle as α-KG, which could then be converted into glutamate by either glutamate dehydrogenase (GDH) or an aminotransferase. Astrocytic glutamate is converted to glutamine (Gln) by glutamine synthetase, a chemical reaction consuming one ATP. Several ions (e.g. Na+, K+, H+, Cl) are co/anti transported with glutamate and GABA while these neurotransmitters are taken up by astrocytes. ATP are required by different ATPases to reestablish the ionic equilibrium concentrations. Pyr could enter the TCA-cycle in astrocytes to supply needed carbons (dotted blue line).
Fig. 3
Fig. 3
Diagram of the PDH-complex/TCA-cycle. The PDH-complex comprises just one step: a decarboxylation [enzymes (PDH “E1”, dihydrolipoyl transacetylase “E2”, dihydrolipoyl dehydrogenase “E3”), substrates (Pyr, CoA-SH, NAD+), products (Acetyl-CoA, CO2, NADH), comment (there are multiples copies of the enzymes E1, E2 and E3, depending on species)]. In order to sense the cellular energy charge, two enzymes (i.e. the PDH-kinase and the PHD-phosphatase) are endowed with a variety of allosteric modulators and covalent modifiers. These enzymes compete to determine the state of phosphorylation of the PDH-complex, and consequently to regulate its activity. The negative and positive allosteric effectors to the PDH-complex are highlighted in blue and orange, respectively. The TCA-cycle comprises eight steps: a condensation [enzyme (CS), substrates (OAA, Acetyl-CoA, H2O), products (citrate, CoA-SH), comment (it is also referred to as the first committed step in the cycle)], an isomerization [enzyme (aconitinase), substrate (citrate), product (isocitrate), comment (H2O is used for a sequential dehydration and hydration, with the cis-Aconitate as the intermediate)], a first oxidative decarboxylation [enzyme (IDH), substrates (isocitrate, NAD+), products (α-KG, NADH, CO2), comment (isocitrate is firstly oxidized to oxalosuccinate, which in turn decarboxylates to α-KG)], a second oxidative decarboxylation [multienzyme complex (α-KGDH), substrates (α-KG, NAD+, CoA-SH), products (Succinyl-CoA, NADH, CO2), comment (it is very exergonic)], a substrate-level phosphorylation [enzyme (SCS), substrates (Succinyl-CoA, GDP, Pi), products (succinate, GTP, CoA-SH), comments (a- a hydrogen ion bound to Pi enters the TCA-cycle, represented in the stoichiometry of the overall chemical reaction, b- GTP is finally used in a trans-phosphorylation catalyzed by the mitochondrial nucleoside diphosphokinase to phosphorylate ADP, producing ATP and generating GDP)], a first dehydrogenation [enzyme (SDHA), substrates (succinate, FAD), products (fumarate, FADH2), comment (SDHA is tightly bound to the mitochondrion inner membrane through the protein subunits SDHB, SDHC, and SDHD, which all constitutes the complex II of the electron-transport chain)], a hydration [enzyme (FH), substrates (fumarate, H2O), product (malate)], a second dehydrogenation [enzyme (MDH), substrates (malate, NAD+), products (OAA, NADH, H+), comment (it is highly endergonic; however, the exergonic character of the upcoming condensation drives OAA formation by mass action principals)]. In spite of the last seven steps in the TCA-cycle being reversible, the cycle always flows in a clockwise direction (black curved arrow). The reason for that is the irreversible character of the condensation with a thermodynamic equilibrium in favor of the products. Glutamate can enter the TCA-cycle by either oxidative deamination catalyzed by GDH or transamination via the aspartate aminotransferase (AAT), an enzymatic reaction producing aspartate from OAA. Abbreviations: IDH → isocitrate dehydrogenase, α-KGDH → α-Ketoglutarate dehydrogenase, SCS → succinyl-CoA synthetase, GDP → guanosine diphosphate, SDHA → succinate dehydrogenase, FAD → flavin adenine dinucleotide (oxidized form), FH → fumarase, MDH → malate dehydrogenase.
Fig. 4
Fig. 4
Principal intracellular metabolite shuttles. A) The MAS for transferring reducing equivalents from the cytosol to the mitochondria. Electrons from glycolysis or from oxidation of lactate to Pyr are transferred from NADH, H+as OAA is converted to malate by cytosolic MDH (cMDH). Malate enters the mitochondrial matrix via the malate/α-ketoglutarate carrier in exchange for α-KG. Electrons are transferred to the electron-transport chain as malate is oxidized to OAA by mitochondrial MDH (mMDH). OAA is subsequently converted to aspartate by transamination with glutamate via mitochondrial AAT (mAAT). The aspartate exits the mitochondria via the aspartate/glutamate carrier (AGC1, aralar1) in an electrogenic exchange for glutamate and a proton. In the cytosol, aspartate is converted to OAA by transamination with α-KG via cytosolic AAT (cAAT) completing the shuttle. B) The glycerol 3-phosphate shuttle for transferring reducing equivalents from the cytosol to the mitochondria. Electrons are transferred from NADH when dihydroxyacetone phosphate is reduced to glycerol 3-phosphate. Glycerol 3-phosphate is reoxidized to dihydroxyacetone phosphate by mitochondrial glycerol 3-phosphate dehydrogenase that is bound to an FAD prosthetic group on the outer side of the inner mitochondrial membrane and electrons are transferred to CoQ and subsequently enter the electron transport chain. Less energy is produced when electrons transferred into the mitochondria via the glycerol 3-phosphate shuttle enter the electron transport chain since FAD is the acceptor rather than NAD. Adapted from drawings/legends of Figs. (1) and (2) in McKenna et al. (2006c).
Fig. 5
Fig. 5
Illustration of the glutamate/GABA-glutamine cycle. The glutamate (Glu) released by a glutamatergic pre-synaptic terminal (left) is mainly taken up into astrocytes, although a small portion could flood back into the terminal through the transporter GLT-1b. In the GABAergic synapse (right), the released GABA is taken up into both the pre-synaptic terminal and the astrocytes, with the former having higher affinity for the neurotransmitter. Inside the astrocyte, GABA is catabolized to succinate before entering the TCA-cycle. The carbon skeleton of this amino acid exits the TCA-cycle as α-KG, which is then transformed to glutamate. The glutamate is amidated to glutamine (Gln) by glutamine synthetase, an enzymatic reaction that benefits adjacent tissues by consuming and detoxifying free ammonia. The synthesized glutamine returns to the pre-synaptic terminals of both glutamatergic and GABAergic neurons, with a preference for the former. In both terminals, glutamine is used to regenerate glutamate and ammonia via phosphate-activated glutaminase (PAG). The regenerated glutamate in the GABAergic pre-synaptic terminal is converted back into GABA via glutamate decarboxylase (GAD). The more relevant a pathway is, the more thick is its arrow.
Fig. 6
Fig. 6
Adapted from Attwell and Laughlin (2001). Distribution of signaling-related ATP usage among different cellular mechanisms when the mean firing rate of neurons is 4 Hz. (A) The ATP use per second per neuron maintaining resting potentials, propagating action potentials through a neuron, and driving pre-synaptic Ca2+ entry, glutamate recycling, and postsynaptic ion fluxes, are shown. (B) Action potential propagation uses 47% of the total signaling energy use, while synaptic currents (postsynaptic receptors) use 34%, maintaining the neuronal and glial resting potentials uses 13%, pre-synaptic Ca2+entry uses 3%, glutamate recycling 3% and Ca2+ transients < 1% of the signaling-related ATP consumption.
Fig. 7
Fig. 7
A schematic representation of the metabolic events triggered by an increase of the neuronal activity in an elemental cortical area (discussed in detail in preceding sections). These metabolic events may be selectively activated depending of the characteristics (e.g. duration and intensity) of the input to the cerebral cortex (black box) as well as the particular cortical region. The pathways directly implicated on the functional hyperemia (red box) are highlighted with red-dashed lines/arrows. The neuronal mass, including excitatory and inhibitory sub-populations, are represented by a dark-grey box (point-like border). The astrocytic gap-connected networks are represented by a light-grey box (point/line-like border). The extracellular milieu is enclosed by dashed-line boxes.

Similar articles

Cited by

References

    1. Abbott NJ, Rönnbäck L, Hansson E. Astrocyte-endothelial interactions at the blood-brain barrier. Nat. Rev. Neurosci. 2006;7:41–53. - PubMed
    1. Almeida A, Moncada S, Bolanos JP. Nitric oxide switches on glycolysis through the AMP protein kinase and 6-phosphofructo-2-kinase pathway. Nat. Cell Biol. 2004;6:45–51. - PubMed
    1. Ames CNS energy metabolism as related to function. Brains Res. Rev. 2000;34:42–68. - PubMed
    1. Ames A, III, Li YY. Energy requirements of glutamatergic pathways in rabbit retina. J. Neurosci. 1992;12:4234–4242. - PMC - PubMed
    1. Ames A, III, Li YY, Heher EC, Kimble CR. Energy metabolism of rabbit retina as related to function: high cost of Na+ transport. J. Neurosci. 1992;12:840–853. - PMC - PubMed

Publication types

LinkOut - more resources