

Memantine decreases hippocampal glutamate levels: a magnetic resonance spectroscopy study
- PMID: 18343551
- PMCID: PMC2789554
- DOI: 10.1016/j.pnpbp.2008.01.016
Memantine decreases hippocampal glutamate levels: a magnetic resonance spectroscopy study
Abstract
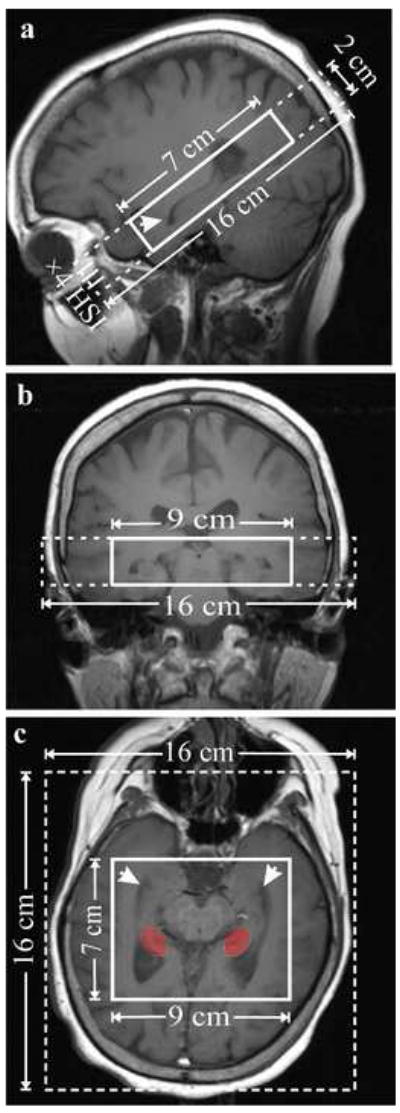
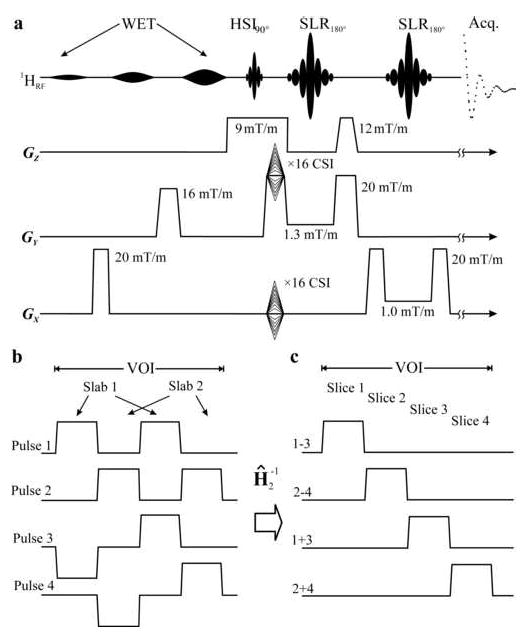
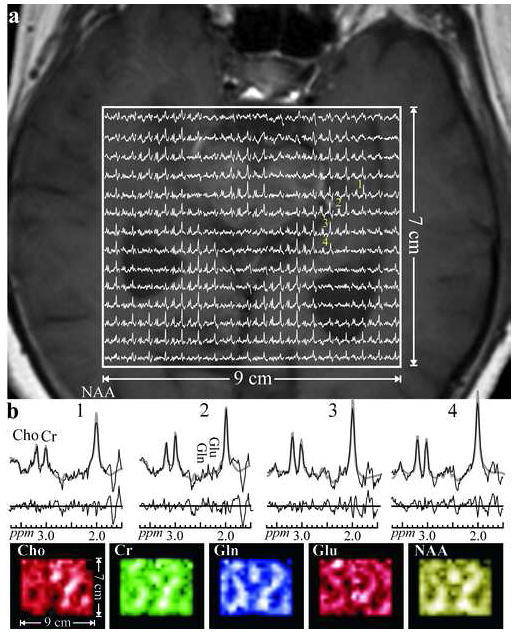
Glutamate (Glu) is associated with excitotoxic cell damage. Memantine modulates the glutamate induced excitotoxicity in Alzheimer's disease (AD). No information is available as to the influence of memantine on in vivo brain glutamate levels. Hippocampal Glu levels were measured in cognitively impaired and normal individuals (n=10) before and after 6 months of memantine treatment, using three dimensional high spatial resolution (0.5 cm(3) voxels) proton magnetic resonance spectroscopy at 3 T. These measurements were also repeated in a non-treated cognitively normal group (n=6). Treatment with memantine decreased Glu/Cr (creatine) ratio in the left hippocampal region. Memantine reduced hippocampal glutamate levels, which may be consistent with its anti-excitotoxic property.
Figures
References
-
- American Psychiatric Association. Diagnostic and Statistical Manual of Mental Disorders. Fourth Edition. Washington, D.C.: American Psychiatric Association; 1994.
-
- Antuono PG, Jones J, Wang Y, Li SJ. Decreased glutamate 1 glutamine in Alzheimer’s disease detected in vivo with 1H-MRS at 0.5 T. Neurol. 2001;56:737–742. - PubMed
-
- Bakchine S, Loft H. Memantine treatment in patients with mild to moderate Alzheimer’s disease: results of a randomised, double-blind, placebo-controlled 6-month study. Journal of Alzheimer’s Disease. 2007:471–479. - PubMed
-
- Bernstein MA, Fain SB, Riederer SJ. Effect of windowing and zero-filled reconstruction of MRI data on spatial resolution and acquisition strategy. J Magn Res Imaging. 2001;14:270–280. - PubMed
-
- Block W, Jessen F, Traber F, Flacke S, Manka C, Lamerichs R, et al. Regional N-acetylaspartate reduction in the hippocampus detected with fast proton magnetic resonance spectroscopic imaging in patients with Alzheimer disease. Arch Neurol. 2002;59:828–834. - PubMed
Publication types
MeSH terms
Substances
Grants and funding
- M01 RR000096/RR/NCRR NIH HHS/United States
- R01 EB001015/EB/NIBIB NIH HHS/United States
- P30 AG08051/AG/NIA NIH HHS/United States
- M01RR00096/RR/NCRR NIH HHS/United States
- EB01015/EB/NIBIB NIH HHS/United States
- AG0305/AG/NIA NIH HHS/United States
- AG12101/AG/NIA NIH HHS/United States
- R01 NS050520/NS/NINDS NIH HHS/United States
- R01 AG022374/AG/NIA NIH HHS/United States
- NS050520/NS/NINDS NIH HHS/United States
- P30 AG008051/AG/NIA NIH HHS/United States
- AG 22374/AG/NIA NIH HHS/United States
- R01 AG012101/AG/NIA NIH HHS/United States
- R56 NS050520/NS/NINDS NIH HHS/United States
LinkOut - more resources
Full Text Sources
