. 2008 May 9;283(19):12811-8.
doi: 10.1074/jbc.M706216200. Epub 2008 Mar 14.

Glial cell line-derived neurotrophic factor reverses ethanol-mediated increases in tyrosine hydroxylase immunoreactivity via altering the activity of heat shock protein 90

Affiliations

Glial cell line-derived neurotrophic factor reverses ethanol-mediated increases in tyrosine hydroxylase immunoreactivity via altering the activity of heat shock protein 90

Dao-Yao He et al. J Biol Chem. .

Abstract

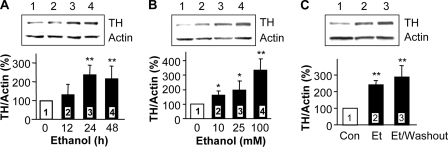
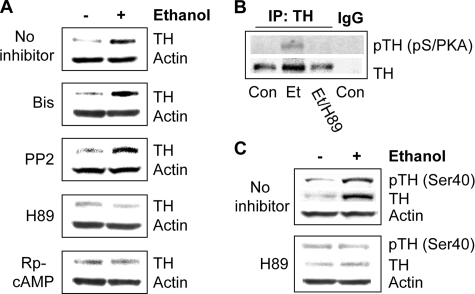
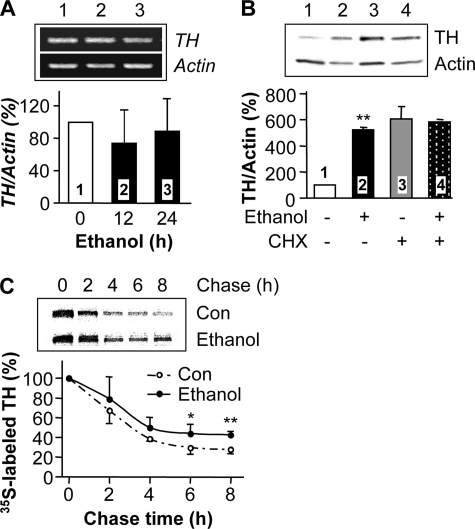
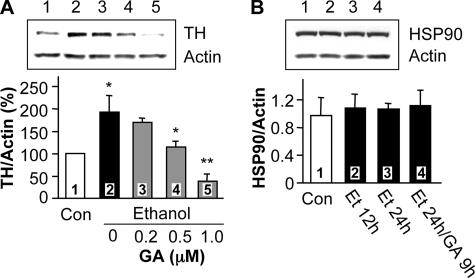
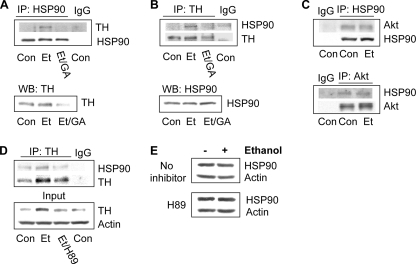
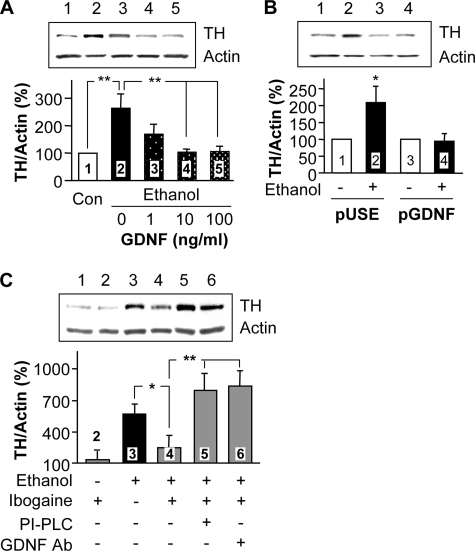
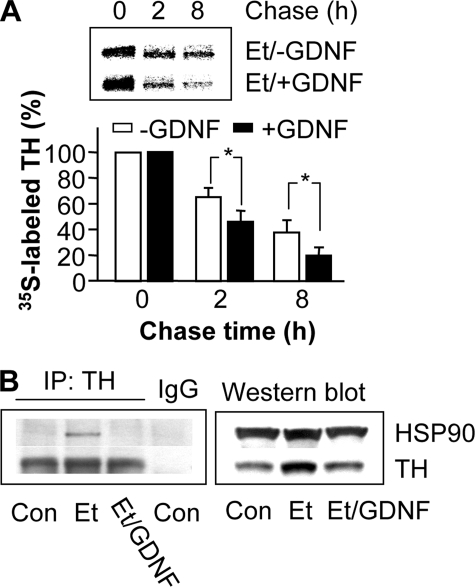
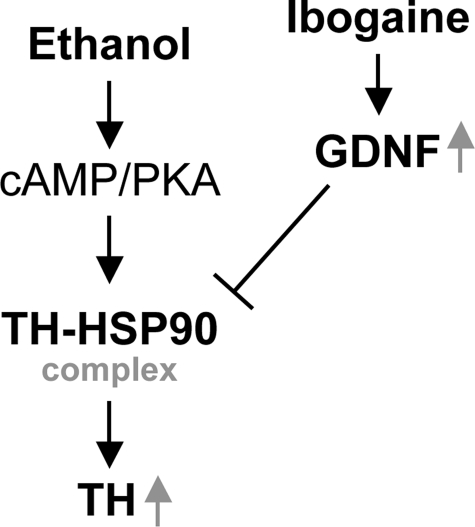
We previously found that glial cell line-derived neurotrophic factor (GDNF) in the midbrain ventral tegmental area (VTA) negatively regulates alcohol drinking (He, D. Y., McGough, N. N., Ravindranathan, A., Jeanblanc, J., Logrip, M. L., Phamluong, K., Janak, P. H., and Ron, D. (2005) J. Neurosci. 25, 619-628). Several studies suggest a role for GDNF in the regulation of tyrosine hydroxylase (TH) levels in the midbrain (Georgievska, B., Kirik, D., and Bjorklund, A. (2004) J. Neurosci. 24, 6437-6445). Up-regulation of TH levels has been reported as a hallmark of biochemical adaptations to in vivo chronic exposure to drugs of abuse, including ethanol (Ortiz, J., Fitzgerald, L. W., Charlton, M., Lane, S., Trevisan, L., Guitart, X., Shoemaker, W., Duman, R. S., and Nestler, E. J. (1995) Synapse 21, 289-298). We hypothesized that GDNF plays an important role in regulating prolonged ethanol-mediated increases in TH protein levels. Using the SH-SY5Y dopaminergic-like cell line, we found that the increase in TH levels in the presence of ethanol required the activation of the cAMP/PKA pathway and was reversed by GDNF. Ethanol treatment did not alter the mRNA level or protein translation of TH, but enhanced the stability of the protein that was decreased by GDNF. Interestingly, we observed that ethanol treatment resulted in an increase in TH association with the chaperone heat shock protein (HSP90) that was mediated by the cAMP/PKA pathway and inhibited by GDNF. Taken together, these data suggest that prolonged ethanol exposure leads to increased association of TH and HSP90 via the cAMP/PKA pathway, resulting in the stabilization and subsequent accumulation of TH. GDNF reverses this ethanol-mediated adaptation by inhibiting the interaction of TH with HSP90.


Figures

FIGURE 1.
FIGURE 1.
Ethanol induces an increase in TH immunoreactivity in a time- and dose-dependent manner. A, SH-SY5Y cells were treated without (lane 1, control) or with 100 mm ethanol (lanes 2–4) for the indicated times. TH protein levels were analyzed by Western blot with anti-TH antibody, and actin protein levels were detected with anti-actin antibody as an internal control. The histogram depicts the mean percentage change in the ratio of TH to actin ± S.D. from seven experiments. B, cells were treated for 24 h without (lane 1, control) or with different concentrations of ethanol (lanes 2–4). The histogram depicts the mean percentage change in the ratio of TH to actin ± S.D. from three experiments. C, cells were treated without (lane 1, control) or with 100 mm ethanol for 24 h (lane 2), or with 100 mm ethanol for 24 h followed by washing with medium and incubation without ethanol for an additional 24 h (lane 3). The histogram depicts the mean percentage change in the ratio of TH to actin ± S.D. from four experiments. *, p < 0.05; **, p < 0.01, compared with lane 1 (control).
FIGURE 2.
FIGURE 2.
Protein kinase A is required for ethanol-mediated increases in TH protein levels. A, cells were treated without or with 100 mm ethanol for 24 h, to which kinase inhibitors were added for the last 9 h of the ethanol treatment as indicated: 1 μm Bis, 1 μm PP2, 5 μm H89, and 40 μm Rp-cAMPS. TH protein levels were detected by Western blot analysis. The image is representative of six experiments. B, cells were treated without (con) or with 100 mm ethanol for 24 h alone (Et) or in combination with 1 μm H89 for the last 9 h (Et/H89). TH was immunoprecipitated using anti-TH antibody and immunoblotted with anti-phospho(Ser/Thr) PKA substrate antibody. The image is representative of four experiments. C, cells were treated without or with 100 mm ethanol for 24 h, to which 1 μm H89 was added for the last 9 h. Phosphorylation of TH was detected by Western blot analysis with anti-phospho(Ser-40)TH antibodies. The image is representative of three experiments.
FIGURE 3.
FIGURE 3.
Chronic ethanol does not increase the transcription and translation of TH, but enhances TH protein stability. A, cells were treated without (lane 1, control) or with 100 mm ethanol for 12 or 24 h (lanes 2 and 3). TH mRNA expression levels were analyzed by RT-PCR with actin mRNA levels as an internal control. The histogram depicts the mean percentage change in the ratio of TH to actin ± S.D. from three experiments. B, cells were treated without (lane 1, control, and lane 3) or with 100 mm ethanol (lanes 2 and 4) for 24 h, and 30 μg/ml CHX was added as indicated for the last 12 h of the 24-h treatment (lanes 3 and 4). TH protein levels were analyzed as described above. The histogram depicts the mean percentage change in the ratio of TH to actin ± S.D. from three experiments. **, p < 0.01, compared with control. C, cells were treated without (control) or with 100 mm ethanol for 24 h before a pulse-chase procedure as described under “Experimental Procedures.” Cells were labeled with 25 μCi of [35S]Met/Cys pro-mix cell labeling mix for 3 h and then incubated in the normal medium for the indicated chase times, followed by immunoprecipitation with anti-TH antibody, separation on an SDS-PAGE gel, and autoradiography. The histogram depicts the mean percentage change in radioactive signals of 35S-labeled TH protein at each chase time to those at initiation of chase (0 time) from six experiments. *, p < 0.05; **, p < 0.01, compared with control.
FIGURE 4.
FIGURE 4.
Geldanamycin, an inhibitor of heat shock protein 90, inhibits chronic ethanol-induced TH accumulation. A, cells were treated without (lane 1) or with 100 mm ethanol for 24 h (lane 2), or with 100 mm ethanol for 24 h to which different doses of GA were added for the last 9 h of ethanol treatment (lanes 3–5). TH protein levels were analyzed as described above. The histogram depicts the mean percentage change in the ratio of TH to actin ± S.D. from three experiments. *, p < 0.05, lanes 2 versus 1, or 4 versus 2; **, p < 0.01, lanes 5 versus 2. B, cells were treated without (Con), or with 100 mm ethanol for 12 h (Et 12h) or 24 h (Et 24h), or 100 mm ethanol for 24 h in which 1 μm GA was added for the last 9 h (Et 24h/GA 9h). Protein levels of HSP90 and actin were measured by Western blot analysis. The histogram depicts the mean ratio of HSP90 to actin ± S.D. from three experiments.
FIGURE 5.
FIGURE 5.
Chronic ethanol induces an association of TH with heat shock protein 90. A and B, cells were treated without (Con) or with 100 mm ethanol for 24 h (Et), or with 100 mm ethanol for 24 h to which 1 μm GA was added for the last 9 h (Et/GA). TH was co-immunoprecipitated with HSP90 using anti-HSP90 antibody (A), and HSP90 was co-immunoprecipitated with TH using anti-TH antibody (B). HSP90 and TH levels in input samples were analyzed by Western blot. Images are representative of four experiments. C, cells were treated without (Con) or with 100 mm ethanol for 24 h (Et). Akt was co-immunoprecipitated with HSP90 using anti-HSP90 antibody (upper panel), and HSP90 was co-immunoprecipitated with Akt using anti-Akt antibody (lower panel). Images are representative of three experiments. D, cells were treated without (Con) or with 100 mm ethanol (Et) for 24 h alone or together with 5 μm H89 for the last 9 h (Et/H89). Cells were homogenized for co-immunoprecipitation of HSP90 with anti-TH antibody. The image is representative of three experiments. E, cells were treated without or with 100 mm ethanol for 24 h, to which 1 μm H89 were added for the last 9 h of the ethanol treatment. HSP90 protein levels were detected by Western blot analysis. The image is representative of six experiments.
FIGURE 6.
FIGURE 6.
GDNF or ibogaine via GDNF reverses ethanol-mediated increases in TH protein levels. A, SH-SY5Y cells were treated without (lane 1) or with 100 mm ethanol for 24 h (lane 2), or 100 mm ethanol for 24 h to which different doses of GDNF were added for the last 12 h of ethanol treatment (lanes 3–5). TH protein levels were analyzed as described above. The histogram depicts the mean percentage change in the ratio of TH to actin ± S.D. from three experiments. **, p < 0.01. B, SH-SY5Y cells stably expressing the pUSE empty vector (pUSE, lanes 1 and 2) and cells stably expressing GDNF (pGDNF, lanes 3 and 4) were treated without (lanes 1 and 3) or with 100 mm ethanol (lanes 2 and 4) for 24 h. TH protein levels were analyzed as described above. The histogram depicts the mean percentage change in the ratio of TH to actin ± S.D. from three experiments. *, p < 0.05, lanes 2 versus 1. C, cells were treated without (lane 1) or with 10 μm ibogaine for 12 h (lane 2), 100 mm ethanol for 24 h (lane 3) or 100 mm ethanol for 24 h to which 10 μm ibogaine was added for the last 12 h of ethanol incubation (lanes 4–6): lane 4, ethanol plus ibogaine, lane 5; ethanol plus ibogaine after 1-h preincubation with PI-PLC (see “Experimental Procedures”), lane 6; ethanol plus ibogaine together with 10 μg/ml of anti-GDNF-neutralizing antibodies. The histogram depicts the mean percentage change in the ratio of TH to actin ± S.D. from three experiments. *, p < 0.05; **, p < 0.01.
FIGURE 7.
FIGURE 7.
GDNF decreases ethanol-mediated stabilization and association of TH with HSP90. A, cells were treated with 100 mm ethanol for 24 h alone (Et/-GDNF) or together with 25 ng/ml GDNF added for the last 12 h (Et/+GDNF) before a pulse-chase procedure as described above with the chase times as indicated. The histogram depicts the mean percentage change in radioactive signals of 35S-labeled TH protein from three experiments. *, p < 0.05. B, cells were treated without (Con) or with 100 mm ethanol for 24 h alone (Et) or in combination with 25 ng/ml GDNF added for the last 12 h (Et/GDNF). Co-immunoprecipitation of HSP90 with TH was analyzed as described above. The image is representative of three experiments.
FIGURE 8.
FIGURE 8.
Suggested schematic diagram of possible components that mediate the up-regulation of TH protein levels following prolonged exposure to ethanol in SH-SY5Y cells. Exposure to ethanol leads to formation of the TH-HSP90 complex via cAMP/PKA, resulting in stabilization and accumulation of TH protein. GDNF, or ibogaine via GDNF, reverses this ethanol-mediated adaptation by inhibition of the association of TH with HSP90, thus down-regulating the protein stability of TH.

Similar articles

Cited by

References

    1. He, D. Y., McGough, N. N., Ravindranathan, A., Jeanblanc, J., Logrip, M. L., Phamluong, K., Janak, P. H., and Ron, D. (2005) J. Neurosci. 25 619–628 - PMC - PubMed
    1. Messer, C. J., Eisch, A. J., Carlezon, W. A., Jr., Whisler, K., Shen, L., Wolf, D. H., Westphal, H., Collins, F., Russell, D. S., and Nestler, E. J. (2000) Neuron 26 247–257 - PMC - PubMed
    1. Georgievska, B., Kirik, D., and Bjorklund, A. (2004) J. Neurosci. 24 6437–6445 - PMC - PubMed
    1. Rosenblad, C., Georgievska, B., and Kirik, D. (2003) Eur. J. Neurosci. 17 260–270 - PubMed
    1. Ortiz, J., Fitzgerald, L. W., Charlton, M., Lane, S., Trevisan, L., Guitart, X., Shoemaker, W., Duman, R. S., and Nestler, E. J. (1995) Synapse 21 289–298 - PubMed

Publication types

MeSH terms

LinkOut - more resources