. 2008 Jul;49(7):2848-55.
doi: 10.1167/iovs.07-1352. Epub 2008 Mar 14.

Mitochondrial proteomics of the retinal pigment epithelium at progressive stages of age-related macular degeneration

Affiliations

Mitochondrial proteomics of the retinal pigment epithelium at progressive stages of age-related macular degeneration

Curtis L Nordgaard et al. Invest Ophthalmol Vis Sci. 2008 Jul.

Abstract

Purpose: Age-related macular degeneration (AMD) is the leading cause of vision loss in individuals over the age of 65. Histopathological changes become evident in the retinal pigment epithelium (RPE), a monolayer that provides metabolic support for the overlying photoreceptors, even at the earliest stages of AMD that precede vision loss. In a previous global RPE proteome analysis, changes were identified in the content of several mitochondrial proteins associated with AMD. In this study, the subproteome of mitochondria isolated from human donor RPE graded with the Minnesota Grading System (MGS) was analyzed.

Methods: Human donor eye bank eyes were categorized into one of four progressive stages (MGS 1-4) based on the clinical features of AMD. After dissection of the RPE, mitochondrial proteins were isolated and separated by two-dimensional gel electrophoresis based on their charge and mass. Protein spot densities were compared between the four MGS stages. Peptides from spots that changed significantly with MGS stage were extracted and analyzed by using mass spectrometry to identify the protein.

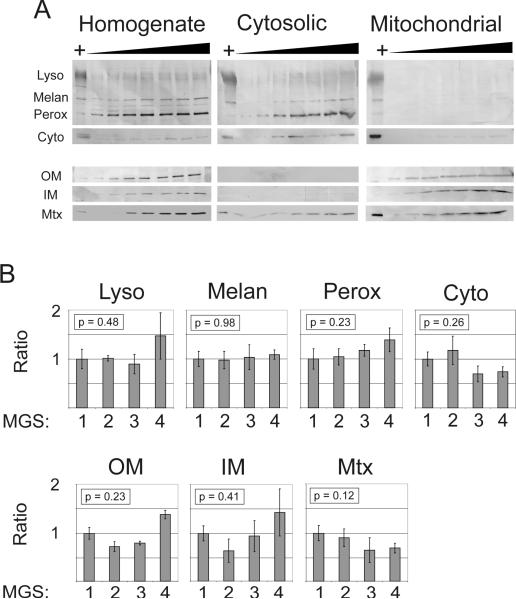
Results: Western blot analyses verified that mitochondria were consistently enriched between MGS stages. The densities of eight spots increased or decreased significantly as a function of MGS stage. These spots were identified as the alpha-, beta-, and delta-ATP synthase subunits, subunit VIb of the cytochrome c oxidase complex, mitofilin, mtHsp70, and the mitochondrial translation factor Tu.

Conclusions: The results are consistent with the hypothesis that mitochondrial dysfunction is associated with AMD and further suggest specific pathophysiological mechanisms involving altered mitochondrial translation, import of nuclear-encoded proteins, and ATP synthase activity.


Figures

Figure 1
Figure 1. Scatter plot comparison of human donor ages between MGS stages
A horizontal bar indicates the mean age for each group. MGS 4 donors were significantly older than any other category of donors (one-way ANOVA, p < 0.005 and the Tukey-Kramer post-hoc test). The differences between stage 1–3 means were not significant.
Figure 2
Figure 2. Verification of mitochondrial enrichment by Western blotting
A) Western blots of RPE fractions (homogenate, cytosolic, and mitochondrial) probed with antibodies specific for organelle markers (Lyso – lysosomes, LAMP-1 antibody; Melan – melanosomes, tyrosinase antibody; Perox – peroxisomes, catalase antibody; Cyto – cytosol, Hsp70 antibody; OM – outer mitochondrial membrane, VDAC antibody; IM – inner mitochondrial membrane, Complex I subunit 6/ND6 antibody; Mtx – mitochondrial matrix, MnSOD antibody). Blots indicate that the fractionation procedure resulted in selective depletion of mitochondria from the cytosolic fraction and selective enrichment of mitochondria in the mitochondrial fraction. Protein loads ranged from 5 to 35 μg of protein in 5 μg increments. The HeLa cell lysate positive control is indicated by `+'. Note that only a faint Hsp70 (Cyto) reaction was detected in the mitochondrial fraction after considerably overexposing the blot, as determined by comparing the positive control reaction intensities. B) Semi-quantitative comparison of subfractionation efficacy between MGS stages. Western blot measurements of organelle markers were compared for multiple samples from each stage. Each cytosol immune reaction was normalized to its corresponding homogenate immune reaction to account for total content differences between samples. Bars represent mean ± standard error, n = 6 for each group. No significant differences were detected for any marker by one-way ANOVA, suggesting that the subfractionation of cellular contents into cytosolic (i.e., nonmitochondrial) and mitochondrial fractions was not affected by MGS stage.
Figure 3
Figure 3. Resolution of mitochondrial fraction proteins by 2D gel electrophoresis
Representative gel demonstrating the resolution of 100 μg of human donor RPE mitochondrial fraction protein. Proteins were separated in the first dimension using a nonlinear pH gradient from 3 to 11 and in the second dimension using 13% SDS-polyacrylamide gel electrophoresis, then stained with silver. Spots that changed significantly by one-way ANOVA or linear regression analysis are boxed and numbered according to Table 2.
Figure 4
Figure 4. Protein spot densities and corresponding protein identity
Individual spot densities were normalized to the total spot density for each gel and compared by one-way ANOVA (A) and linear regression (L). The test that reached significance and its associated p value are indicated above the normalized spot densities, which are reported as the mean ± standard error for each MGS stage. The number of measurements for each stage is indicated below the x-axis. Protein identifications (numbered according to Table 2) were obtained by MALDI-TOF mass spectrometry and verified by tandem mass spectrometry peptide sequencing. Note the y-axis scale difference between the top and bottom panels.
Figure 5
Figure 5. 2D gel analysis of mitochondrial ATP synthase content
A) Mass spectrometry analysis identified multiple ATP synthase α and β protein spots with altered isoelectric focusing points (isoelectric variants, arrows). Only a subset of the isoelectric variants changed significantly with MGS stage (numbered according to Table 2), based upon the initial 2D gel analysis. While the spots identified as ATP synthase α and β migrated as one of several ATP synthase isoelectric variants, ATP synthase δ appeared to migrate as a single spot. B) Total mitochondrial ATP synthase α, β, and δ content was estimated by summing the density of all identified spots (indicated by arrows in A). Mean density values and standard error of the mean were normalized to the greatest density value (MGS 2 for each subunit). The one-way ANOVA for each of the three ATP synthase subunits was significant (all p < 0.04).

References

    1. Buch H, Vinding T, La Cour M, Appleyard M, Jensen GB, Nielsen NV. Prevalence and causes of visual impairment and blindness among 9980 Scandinavian adults: the Copenhagen City Eye Study. Ophthalmology. 2004;111:53–61. - PubMed
    1. Congdon N, O'Colmain B, Klaver CC, et al. Causes and prevalence of visual impairment among adults in the United States. Arch Ophthalmol. 2004;122:477–485. - PubMed
    1. Davis MD, Gangnon RE, Lee LY, et al. The Age-Related Eye Disease Study severity scale for age-related macular degeneration: AREDS Report No. 17. Arch Ophthalmol. 2005;123:1484–1498. - PMC - PubMed
    1. Coleman AL, Yu F. Eye-Related Medicare Costs for Patients with Age-Related Macular Degeneration from 1995 to 1999. Ophthalmology. 2007 - PubMed
    1. Mitchell J, Bradley C. Quality of life in age-related macular degeneration: a review of the literature. Health and quality of life outcomes. 2006;4:97. - PMC - PubMed

Publication types

MeSH terms