. 2008 Jun;131(Pt 6):1478-91.
doi: 10.1093/brain/awn050. Epub 2008 Mar 15.

Changes in sensory-evoked synaptic activation of motoneurons after spinal cord injury in man

Affiliations

Changes in sensory-evoked synaptic activation of motoneurons after spinal cord injury in man

Jonathan A Norton et al. Brain. 2008 Jun.

Abstract

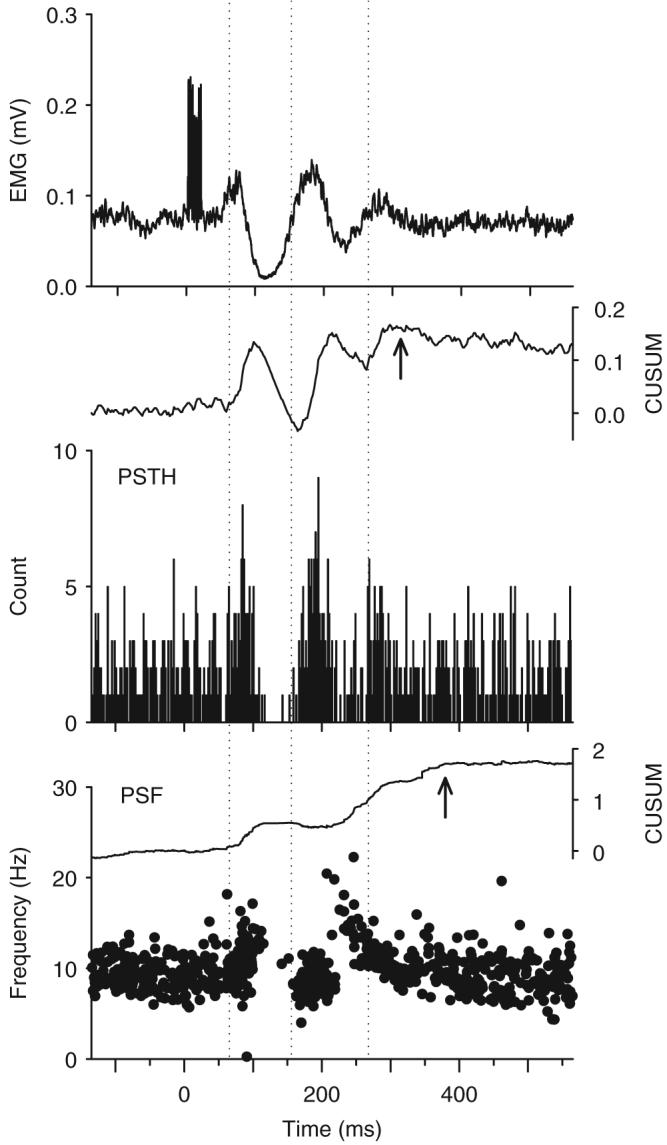
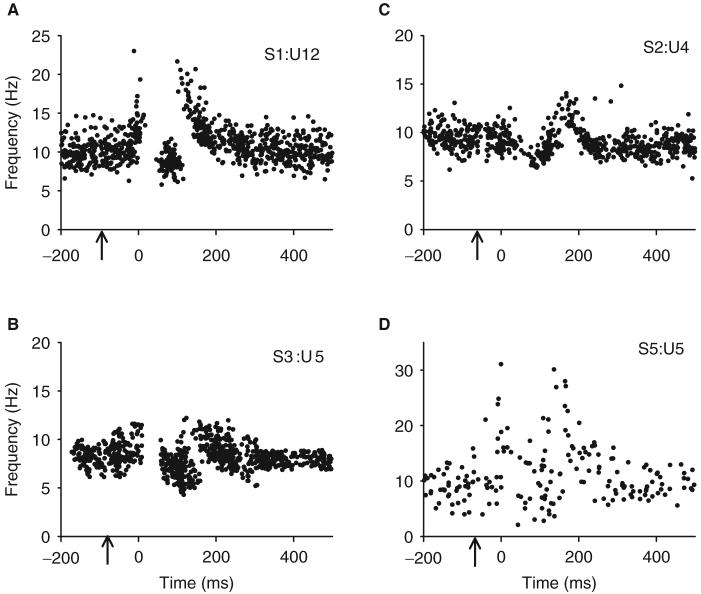
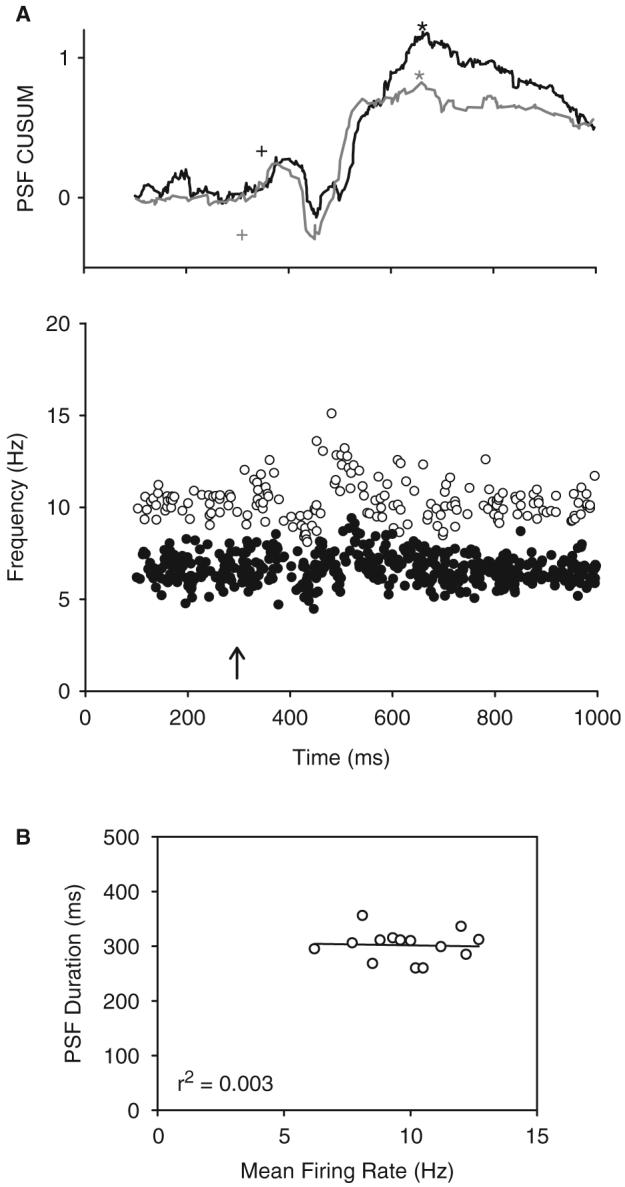
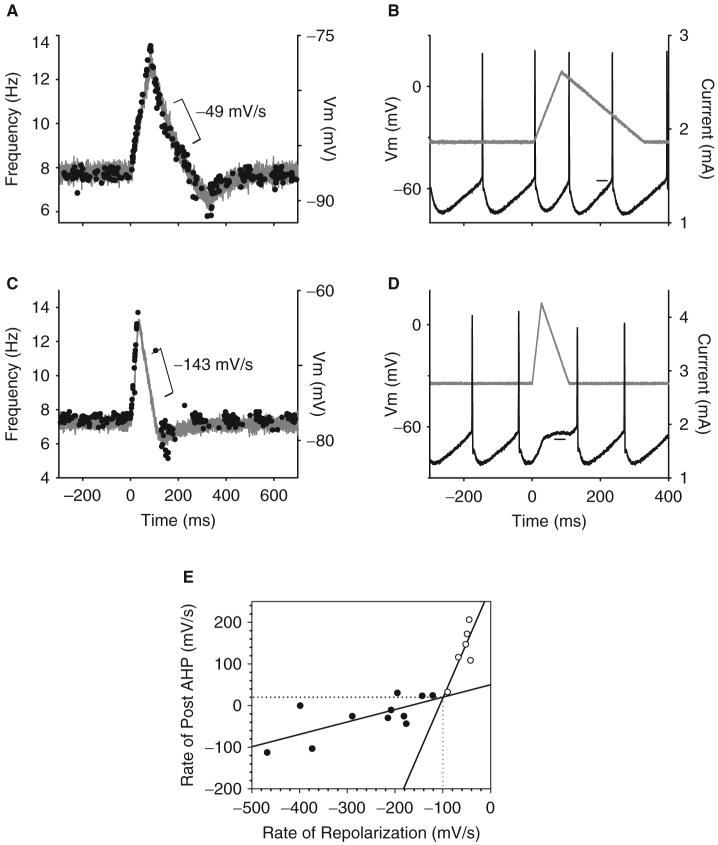
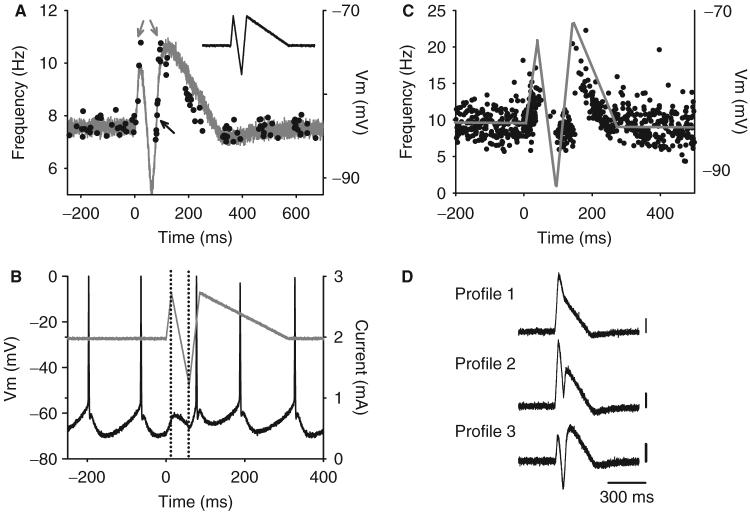
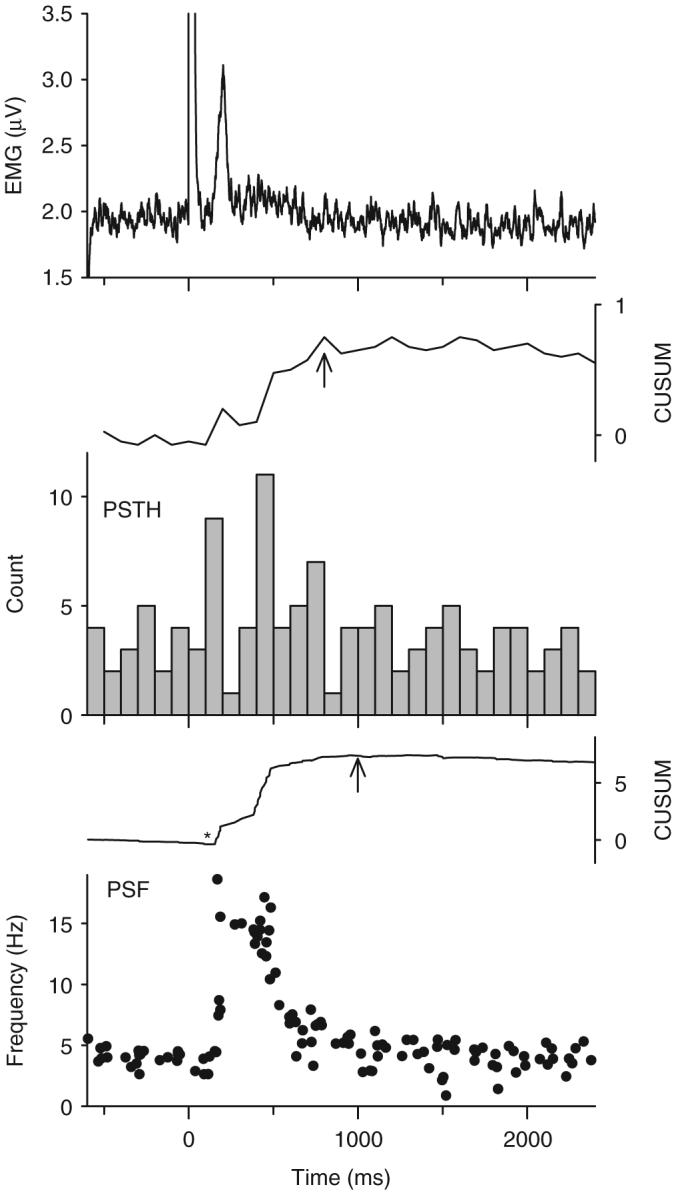
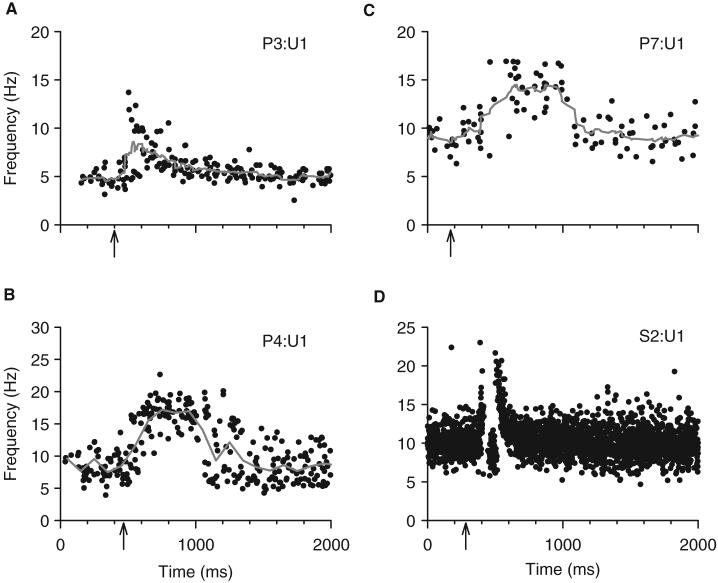
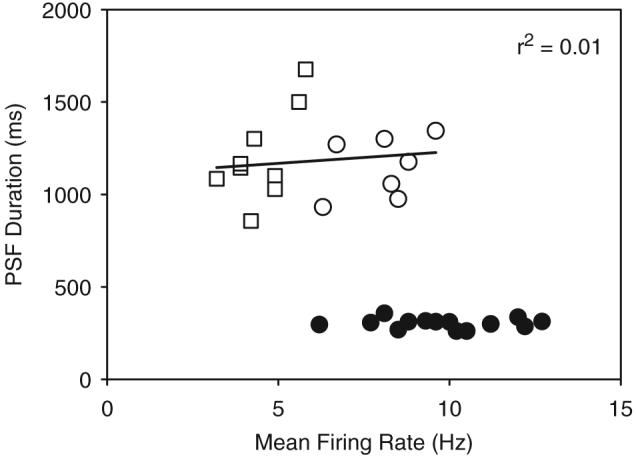
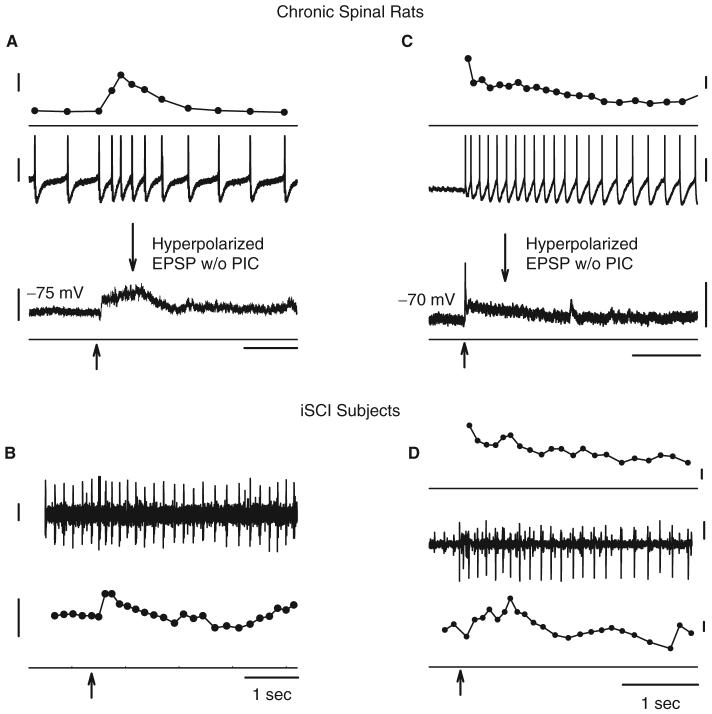
Following spinal cord injury (SCI), prolonged muscle spasms are readily triggered by brief sensory stimuli. Animal and indirect human studies have shown that a substantial portion of the depolarization of motoneurons during a muscle spasm comes from the activation of persistent inward currents (PICs). The brief (single pulse) sensory stimuli that trigger the PICs and muscle spasms in chronically spinalized animals evoke excitatory post-synaptic potentials (EPSPs) that are broadened to more than 500 ms, the duration of depolarization required to activate a PIC in the motoneuron. Thus, in humans, we investigated if post-synaptic potentials (PSPs) evoked from brief (<20 ms) sensory stimulation are changed after SCI and if they are broadened to > or =500 ms to more readily activate motoneuron PICs and muscle spasms. To estimate both the shape and duration of PSPs in human subjects we used peristimulus frequencygrams (PSFs), which are plots of the instantaneous firing frequency of tonically active single motor units that are time-locked to the occurrence of the sensory stimulus. PSFs in response to cutaneomuscular stimulation of the medial arch or toe of the foot, a sensory stimulus that readily triggers muscle spasms, were compared between non-injured control subjects and in spastic subjects with chronic (>1 year), incomplete SCI. In non-injured controls, a single shock or brief (<20 ms) train of cutaneomuscular stimulation produced PSFs consisting of a 300 ms increase in firing rate above baseline with an interposed period of reduced firing. Parallel intracellular experiments in motoneurons of adult rats revealed that a 300 ms EPSP with a fast intervening inhibitory PSP (IPSP) reproduced the PSF recorded in non-injured subjects. In contrast, the same brief sensory stimulation in subjects with chronic SCI produced PSFs of comparatively long duration (1200 ms) with no evidence for IPSP activation, as reflected by a lack of reduced firing rates after the onset of the PSF. Thus, unlike non-injured controls, the motoneurons of subjects with chronic SCI are activated by very long periods of pure depolarization from brief sensory activation. It is likely that these second-long EPSPs securely recruit slowly activating PICs in motoneurons that are known to mediate, in large part, the many seconds-long activation of motoneurons during involuntary muscle spasms.


Figures

Fig. 1
Fig. 1
Example of a cutaneomuscular reflex response recorded in a non-injured control subject. Stimulation to the medial arch of the foot (7 pulses at 500 Hz, 16 mA) produced a polyphasic modulation in the rectified TA EMG (top trace) beginning at a latency of 70 ms (stimulation occurred at time 0). Likewise, a simultaneously recorded motor unit exhibited three main clusters of increased firing probability (PSTH: middle graph) at 70, 162 and 272 ms after the stimulation (marked by the dotted vertical lines). The firing rate of the unit, as depicted in the PSF (bottom graph), was above the mean rate for a period of 322 ms, as reflected in the time to reach the peak in the PSF CUSUM (at arrow in PSF CUSUM) from its initial increase. The peak of the PSTH CUSUM occurred earlier (at arrow in PSTH CUSUM), even though the firing rate was still above the mean pre-stimulation rate. Bin width of PSTH=2 ms. N=300 trials. CUSUM values are plotted as extra counts (PSTH) or frequencies (PSF) above background divided by the number of stimuli.
Fig. 2
Fig. 2
(A-D) Examples of four different PSFs recorded from four different non-injured control subjects. Arrows indicate time of stimulation. Initial rising edge of PSF is aligned at time 0. Although the shapes of the PSF profiles vary between subjects, the duration of time that the firing rate was above the pre-stimulation mean rate was very consistent (301±27 ms, n=9 units from six subjects). S(n)=subject code; U(n)=motor unit code.
Fig. 3
Fig. 3
The effect of background firing rate on the PSF. (A) PSFs (bottom graph) and associated CUSUMs (top graph) from a single motor unit firing at a low (6.6 Hz: solid circles and black lines) and high (10.2 Hz: open circles and grey lines) pre-stimulus mean rate. Note that time to the peak of the CUSUM (asterisk) was similar for both trials with the onset of the rise in the PSF occurring at 76 ms during slow firing (black cross) and 40 ms during fast firing (grey cross). (B) When comparing all 13 units from the six non-injured control subjects (multiple PSFs from the same unit were not averaged here), there was no relationship between mean pre-stimulation firing rate and PSF duration. r2=coefficient of determination.
Fig. 4
Fig. 4
In vitro intracellular recordings of an adult rat motoneuron in response to injected current. (A) Triangular current injection with a slow speed of repolarization (grey trace in B) produced a slow decrease in membrane potential (-49 mV/s) recorded during cell hyper-polarization (simulated PSP: grey trace). The firing frequency of the motoneuron (PSF) closely followed the profile of the simulated PSP, even during the repolarization phase. (B) Corresponding example of membrane potential during cell firing reveals that the post-AHP trajectory (horizontal line) is not flattened during the period of cell repolarization and, thus, no pause in cell firing occurred. (C) In the same cell, a fast rate of repolarization (-143 mV/s) produced a pause in motoneuron firing as a result of flattening the trajectory of the membrane potential after the AHP during the period of fast repolarization (horizontal line in D) to broaden the interspike interval. (E) Relationship between the rate of decrease of the simulated PSP during cell repolarization (as shown in A and C) and the slope of the post-AHP membrane potential (as shown in B and D). Open symbols denote trials where no pause in firing was produced (as in A) withan average repolarization slope of -57±18 mV/s and a post-AHP slope of 130±60 mV/s; closed symbols denote when a pause in motoneuron firing occurred (as in C), with an average repolarization slope of -252±114 mV/s and post-AHP slope of 25±48 mV/s (corresponding values significantly different, P<0.001). Intersection of regression lines fit for no-pause and pause data occurs at 20.1 mV/s on y-axis and -101 mV/s on x-axis (see dotted lines).
Fig. 5
Fig. 5
Simulated PSP that replicates PSF recorded in non-injured controls. Same format as in Fig. 4. Firing response (A) and corresponding membrane potential (B) of rat motoneuron to a simulated PSP profile containing a 300 ms EPSP with a fast (-440 mV/s) intervening IPSP. Note in B that the pause in motoneuron firing is due to a downward deflection of the membrane potential-during the hyperpolarizing current injection (marked by dotted vertical lines). In A, the firing rate of the motoneuron follows the trajectory of the slow repolarization of the simulated PSP (-59 mV/s in A; -37.7±13.3 mV/s in all seven cells). (C) PSF profile of non-injured control subject and the estimated PSP (grey trace) that likely produced it based on the intracellular data in A.(D) Different profiles of simulated PSPs used to replicate the human PSF data. Calibration bar=10mV.
Fig. 6
Fig. 6
Example of a cutaneomuscular reflex response in iSCI subject P5. Same format as in Fig. 1. Stimulation to the medial arch of the foot (3 pulses, 100 Hz, 35 mA at time 0) produced a long-duration increase in mean firing rate of the unit as shown in the PSF (bottom graph), which was initiated 130 ms after the stimulation (asterisk in PSF CUSUM). The duration of the PSF, as measured by the time to peak of the PSF CUSUM (at arrow), was 850 ms. The rectified EMG (top graph) showed a similar duration of modulation. The PSTH (middle graph) showed less striking modulation as the PSF with a decrease in firing probability immediately following the first increase (near 200 ms) when rates in the PSF were high. Bin width of the PSTH=100 ms. N=25 trials.
Fig. 7
Fig. 7
Examples of different PSF profiles recorded from three iSCI subjects during spontaneous (A) and voluntary (B and C) motor unit activation. The grey lines show the mean PSF for each unit. Arrows mark the time of stimulation. (D) A PSF from a non-injured control subject is plotted on the same time scale for comparison. P(n)=iSCI subject code; U(n)=motor unit code.
Fig. 8
Fig. 8
Relationship between the mean background firing of a motor unit recorded before cutaneomuscular stimulation (x-axis) and the duration of the PSF (y-axis) in subjects with iSCI: voluntary unit activity=open circles; spontaneous unit activity=open squares; comparative data from non-injured controls=closed circles. The regression line that fits through all iSCI data points gave a coefficient of variation (r2) of 0.01 (not significant).
Fig. 9
Fig. 9
Recordings from rat motoneurons (A and C) and human motor units (B and D) during single-shock sensory stimulation (at arrows). (A) Low threshold (2× sensory threshold) stimulation to dorsal root of chronic (2 months) spinal rat produces a 1-s-long increase in firing rate of the tonically firing motoneuron (firing rate top trace; membrane potential middle trace) as a result of a sensory-evoked EPSP revealed by hyperpolarizing the motoneuron (bottom trace). (B) A similar change in firing rate of a tonically firing motor unit is shown for a single stimulation trial in iSCI subject P6 (intramuscular EMG top trace; firing rate bottom trace). (C) Prolonged activation of a motoneuron recruited by a 1s-long EPSP (see hyperpolarized response in bottom trace) due to activation of PIC. (D) Newly recruited motor unit continues to discharge in iSCI subject P3 (surface EMG, middle trace) after firing rate in a tonically firing motor unit returns to pre-recruitment level (bottom trace), an indication of PIC activation. The firing response of the newly recruited unit is shown in the top trace. Calibration bars: firing rate 2 Hz; membrane potential 20 mV; EMG 100 μV; time 1s.

Similar articles

Cited by

References

    1. Baker LL, Chandler SH. Characterization of postsynaptic potentials evoked by sural nerve stimulation in hindlimb motoneurons from acute and chronic spinal cats. Brain Res. 1987;420:340–50. - PubMed
    1. Bennett DJ, Li Y, Sanelli L. Role of NMDA in spasticity following sacral spinal cord injury in rats. Soc Neurosci Abstr. 2001a;31:933.11.
    1. Bennett DJ, Li Y, Siu M. Plateau potentials in sacrocaudal motoneurons of chronic spinal rats, recorded in vitro. J Neurophysiol. 2001b;86:1955–71. - PubMed
    1. Bennett DJ, Sanelli L, Cooke CL, Harvey PJ, Gorassini MA. Spastic long-lasting reflexes in the awake rat after sacral spinal injury. J. Neurophysiol. 2004;91:2247–58. - PubMed
    1. Bessou P, Laporte Y, Pages B. Frequencygrams of spindle primary endings elicited by stimulation of static and dynamic fusimotor fibres. J Physiol. 1968;196:47–63. - PMC - PubMed

Publication types