An epidemiologic comparison of high school sports injuries sustained in practice and competition
- PMID: 18345346
- PMCID: PMC2267335
- DOI: 10.4085/1062-6050-43.2.197
An epidemiologic comparison of high school sports injuries sustained in practice and competition
Abstract
Context: More than 7 million US high school students play sports.
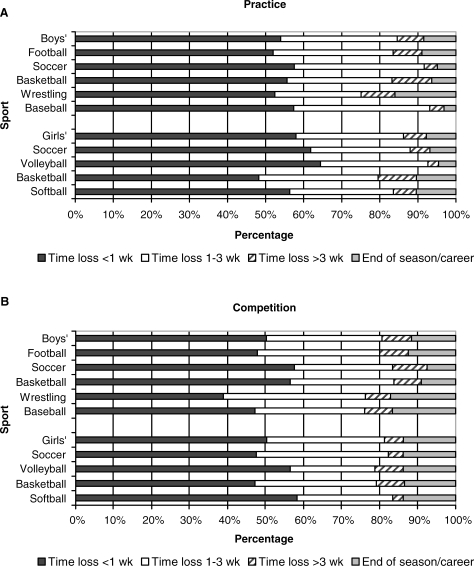
Objective: To compare practice and competition injury rates and patterns in 5 boys' sports (football, soccer, basketball, wrestling, and baseball) and 4 girls' sports (soccer, volleyball, basketball, and softball) during the 2005-2006 school year.
Design: Prospective injury surveillance study.
Setting: Injury data were collected from 100 nationally representative United States high schools via High School RIO (Reporting Information Online).
Patients or other participants: Athletes from participating high schools injured while participating in a school-sanctioned practice or competition in one of the above sports.
Main outcome measure(s): Practice and competition injury rates, body site, diagnosis, and severity.
Results: High school athletes participating in these 9 sports at participating schools sustained 4350 injuries during the 2005-2006 school year, which corresponds to an estimated 1 442 533 injuries nationally. The rate of injury per 1000 athlete-exposures was higher in competition (4.63) than in practice (1.69) (rate ratio [RR] = 2.73, 95% confidence interval [CI] = 2.58, 2.90). Of all sports, football had the highest competition (12.09) and practice (2.54) injury rates per 1000 athlete-exposures. Compared with injuries sustained during practice, higher proportions of competition injuries were head/face/neck injuries (proportion ratio [PR] = 1.61, 95% CI = 1.34, 1.94), particularly in boys' soccer (PR = 7.74, 95% CI = 2.53, 23.65) and girls' basketball (PR = 6.03, 95% CI = 2.39, 15.22). Competition injuries were more likely to be concussions (PR = 2.02, 95% CI = 1.56, 2.62), especially in boys' soccer (PR = 6.94, 95% CI = 2.01, 23.95) and girls' basketball (PR = 5.83, 95% CI = 2.06, 16.49). Higher proportions of competition injuries caused the athlete to miss more than 3 weeks of play (PR = 1.28, 95% CI = 1.08, 1.52), particularly in baseball (PR = 3.47, 95% CI = 1.48, 8.11) and volleyball (PR = 2.88, 95% CI = 1.01, 8.24).
Conclusions: Rates and patterns of high school sport injuries differed between practice and competition. Providing athletic trainers with this information is a crucial step in developing the targeted, evidence-based interventions required to effectively reduce injury rates among the millions of high school student-athletes.
Keywords: injury rates; injury surveillance.
Figures
References
-
- National Federation of State High School Associations. 2005–06 High school athletics participation survey. http://nfhs.org/core/contentmanager/uploads/2005_06NFHSparticipationsurv.... Accessed November 2006.
-
- National Federation of State High School Associations. The case for high school activities. http://www.nfhs.org/web/2004/01/the_case_for_high_school_activities.aspx, Accessed February 6, 2007.
-
- Centers for Disease Control and Prevention (CDC) Sports-related injuries among high school athletes—United States, 2005–06 school year. MMWR Morb Mortal Wkly Rep. 2006;55(38):1037–1040. - PubMed
-
- Emery C.A, Meeuwisse W.H, Hartmann S.E. Evaluation of risk factors for injury in adolescent soccer: implementation and validation of an injury surveillance system. Am J Sports Med. 2005;33(12):1882–1891. - PubMed
Publication types
MeSH terms
Grants and funding
LinkOut - more resources
Full Text Sources
Medical
Research Materials