

Longevity-fertility trade-offs in the tephritid fruit fly, Anastrepha ludens, across dietary-restriction gradients
- PMID: 18346215
- PMCID: PMC2574784
- DOI: 10.1111/j.1474-9726.2008.00389.x
Longevity-fertility trade-offs in the tephritid fruit fly, Anastrepha ludens, across dietary-restriction gradients
Abstract
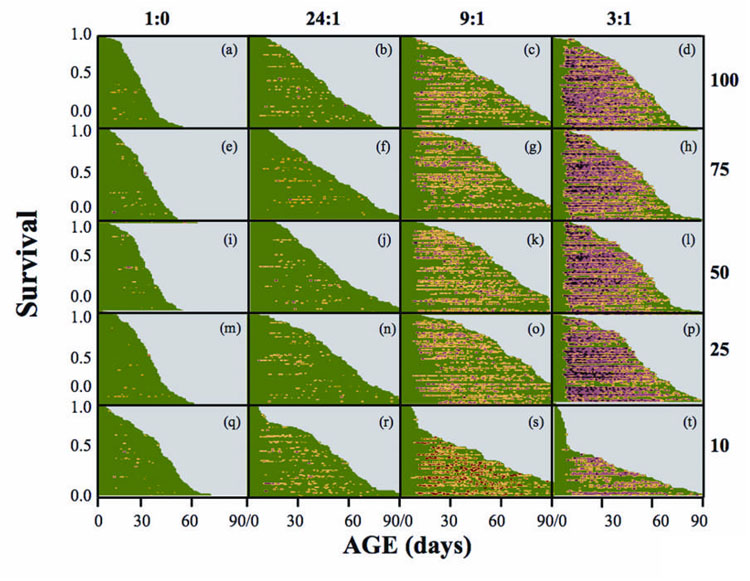
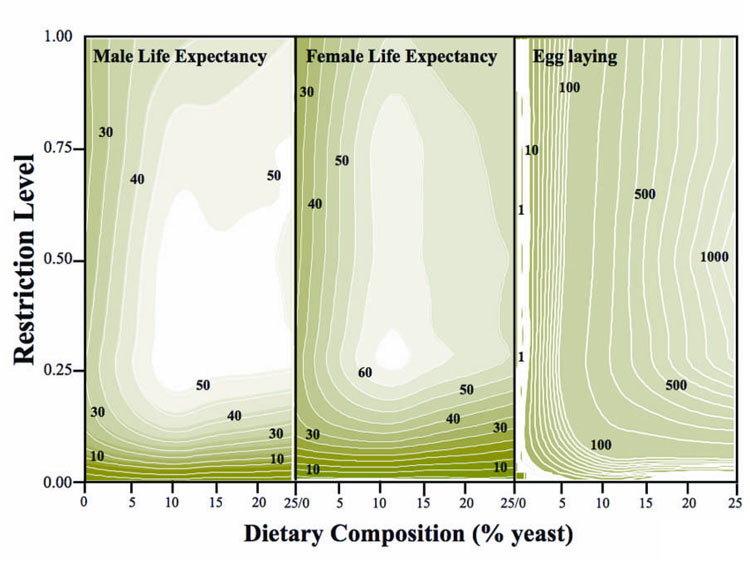
Although it is widely known that dietary restriction (DR) not only extends the longevity of a wide range of species but also reduces their reproductive output, the interrelationship of DR, longevity extension and reproduction is not well understood in any organism. Here we address the question: 'Under what nutritional conditions do the longevity-enhancing effects resulting from food restriction either counteract, complement or reinforce the mortality costs of reproduction? To answer this question we designed a fine-grained DR study involving 4800 individuals of the tephritid fruit fly, Anastrepha ludens, in which we measured sex-specific survival and daily reproduction in females in each of 20 different treatments (sugar : yeast ratios) plus 4 starvation controls. The database generated from this 3-year study consisted of approximately 100 000 life-days for each sex and 750 000 eggs distributed over the reproductive lives of 2400 females. The fertility and longevity-extending responses were used to create contour maps (X-Y grid) that show the demographic responses (Z-axis) across dietary gradients that range from complete starvation to both ad libitum sugar-only and ad libitum standard diet (3 : 1 sugar : yeast). The topographic perspectives reveal demographic equivalencies along nutritional gradients, differences in the graded responses of males and females, egg production costs that are sensitive to the interaction of food amounts and constituents, and orthogonal contours (equivalencies in longevity or reproduction) representing demographic thresholds related to both caloric content and sugar : yeast ratios. In general, the finding that lifespan and reproductive maxima occur at much different nutritional coordinates poses a major challenge for the use of food restriction (or a mimetic) in humans to improve health and extend longevity in humans.
Figures

References
-
- Austad SN. Life extension by diet restriction in the bowl and doily spider. Frontinella pyramitela. Exper. Geront. 1989;24:83–92. - PubMed
-
- Austad SN, Kristan DM. Are mice calorically restricted in nature? Aging Cell. 2003;2:201–207. - PubMed
-
- Bateman MA. The ecology of fruit flies. Ann. Review of Entom. 1972;17:493–518.
-
- Bhandari P, Jones MA, Martin I, Grotewiel MS. Dietary restriction alters demographic but not behavioral aging in Drosophila. Aging Cell. 2007;6:631–637. - PubMed
Publication types
MeSH terms
Grants and funding
LinkOut - more resources
Full Text Sources
Molecular Biology Databases
