

A meta-analysis of hippocampal atrophy rates in Alzheimer's disease
- PMID: 18346820
- PMCID: PMC2773132
- DOI: 10.1016/j.neurobiolaging.2008.01.010
A meta-analysis of hippocampal atrophy rates in Alzheimer's disease
Abstract
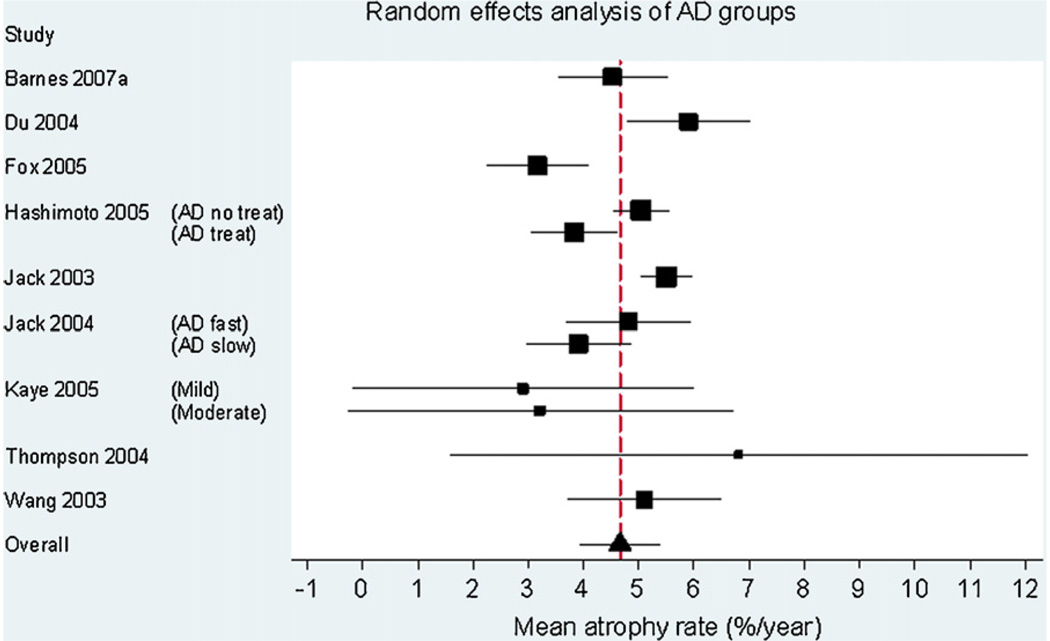
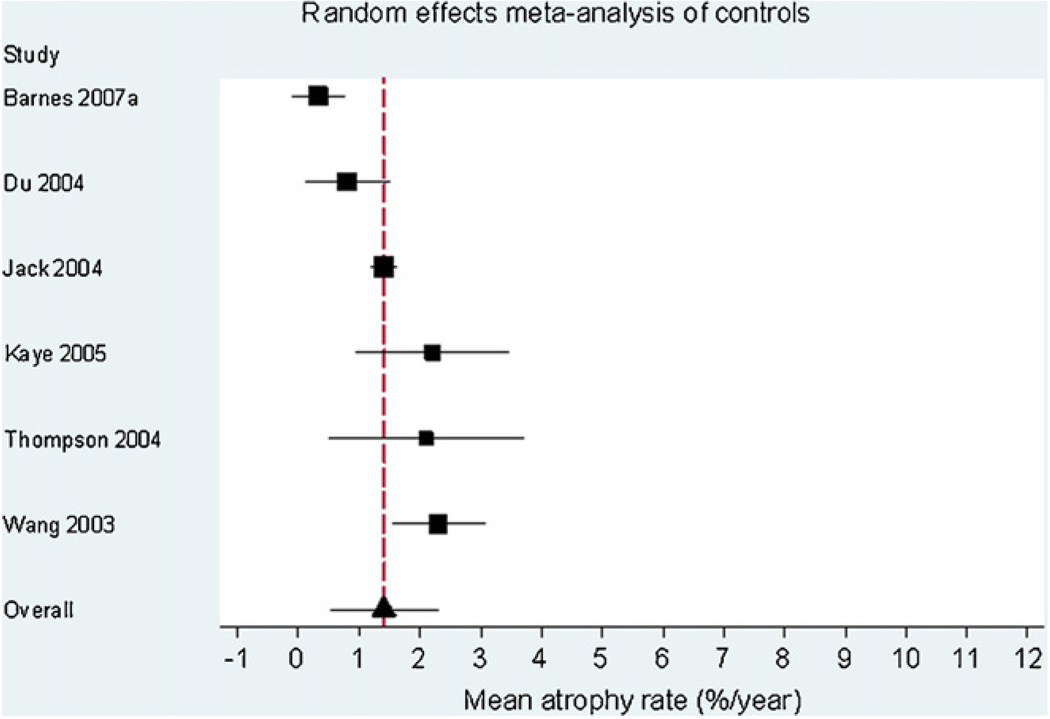
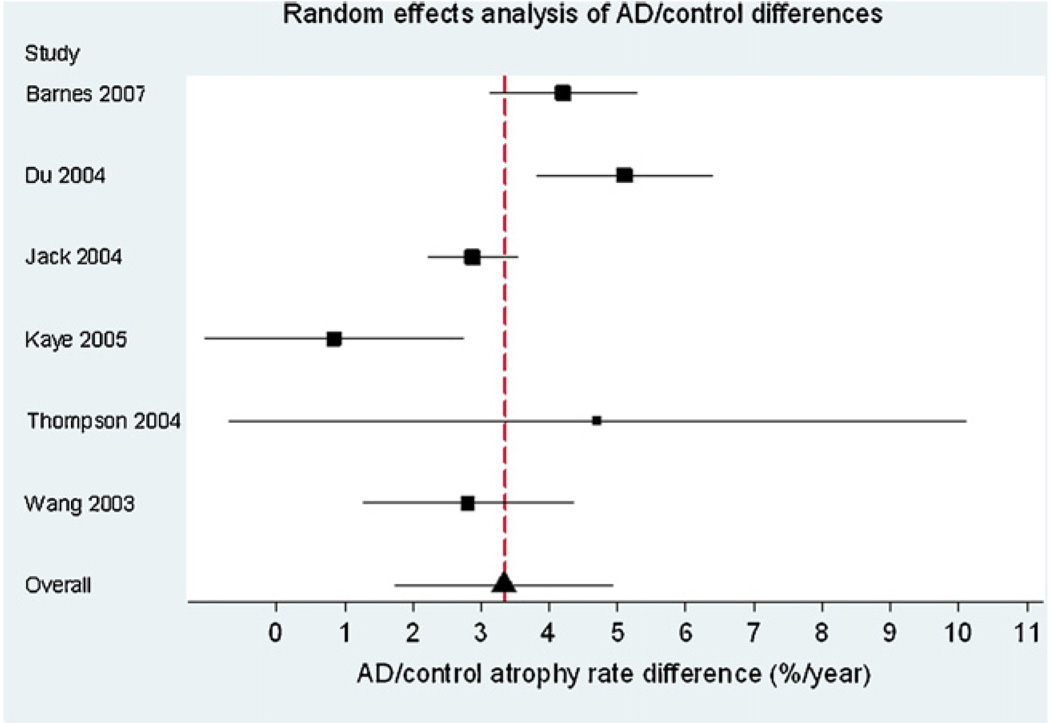
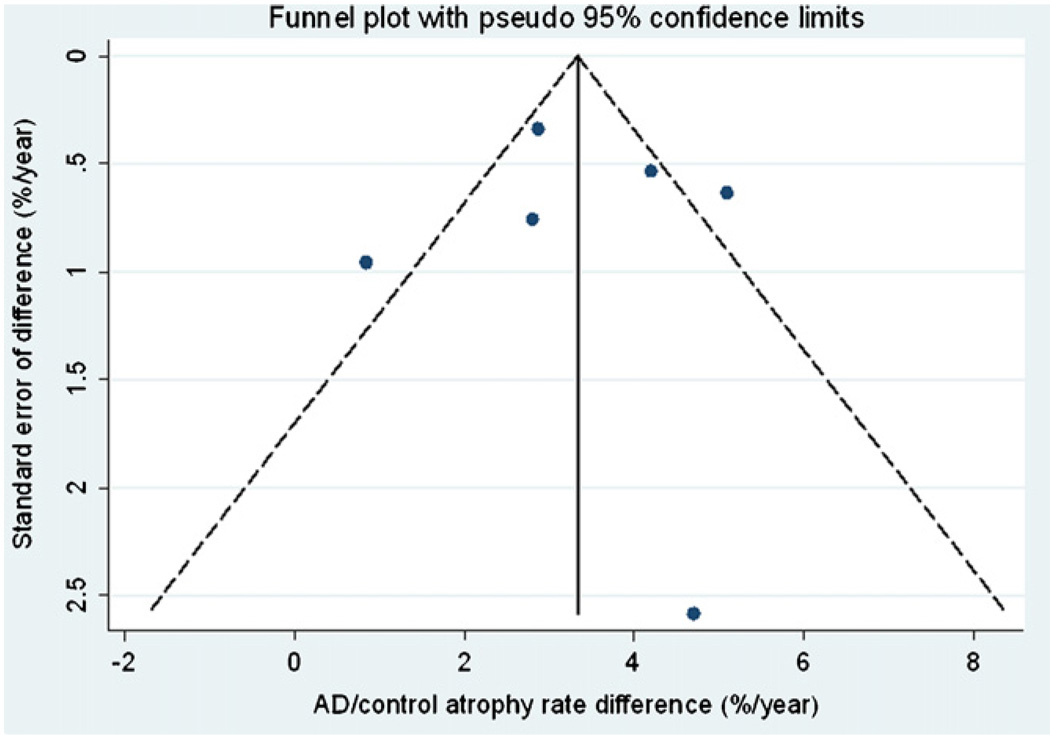
Hippocampal atrophy rates are useful in both diagnosing and tracking Alzheimer's disease (AD). However, cohorts and methods used to determine such rates are heterogeneous, leading to differences in reported annualised rates. We performed a meta-analysis of hippocampal atrophy rates in AD patients and matched controls from studies reported in the peer-reviewed literature. Studies reporting longitudinal volume change in hippocampi in AD subjects together with controls were systematically identified and appraised. All authors were contacted either to confirm the results or to provide missing data. Meta-analysis and meta-regression were then performed on this data. Nine studies were included from seven centres, with data from a total of 595 AD and 212 matched controls. Mean (95% CIs) annualised hippocampal atrophy rates were found to be 4.66% (95% CI 3.92, 5.40) for AD subjects and 1.41% (0.52, 2.30) for controls. The difference between AD and control subject in this rate was 3.33% (1.73, 4.94).
Figures
References
-
- Barnes J, Godbolt AK, Frost C, Boyes RG, Jones BF, Scahill RI, Rossor MN, Fox NC. Atrophy rates of the cingulate gyrus and hippocampus in AD and FTLD. Neurobiol. Aging. 2007a;28:20–28. - PubMed
-
- Barnes J, Boyes RG, Lewis EB, Schott JM, Frost C, Scahill RI, Fox NC. Automatic calculation of hippocampal atrophy rates using a hippocampal template and the boundary shift integral. Neurobiol. Aging. 2007b;28:1657–1663. - PubMed
-
- Barnes J, Scahill RI, Boyes RG, Frost C, Lewis EB, Rossor CL, Rossor MN, Fox NC. Differentiating AD from aging using semiautomated measurement of hippocampal atrophy rates. Neuroimage. 2004;23:574–581. - PubMed
-
- Barnes J, Scahill RI, Schott JM, Frost C, Rossor MN, Fox NC. Does Alzheimer’s disease affect hippocampal asymmetry? Evidence from a cross-sectional and longitudinal volumetric MRI study. Dement. Geriatr. Cogn. Disord. 2005;19:338–344. - PubMed
-
- Braak H, Braak E, Bohl J. Staging of Alzheimer-related cortical destruction. Eur. Neurol. 1993;33:403–408. - PubMed
Publication types
MeSH terms
Grants and funding
LinkOut - more resources
Full Text Sources
Medical
