. 2008 May;76(5):2008-17.
doi: 10.1128/IAI.01691-07. Epub 2008 Mar 17.

T cells help to amplify inflammatory responses induced by Salmonella enterica serotype Typhimurium in the intestinal mucosa

Affiliations

T cells help to amplify inflammatory responses induced by Salmonella enterica serotype Typhimurium in the intestinal mucosa

Ivan Godinez et al. Infect Immun. 2008 May.

Abstract

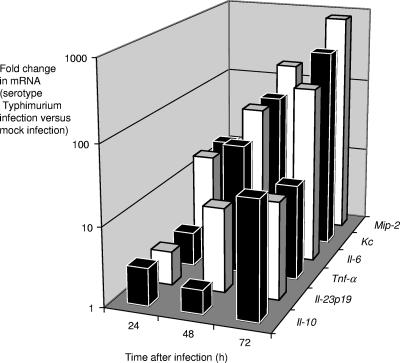
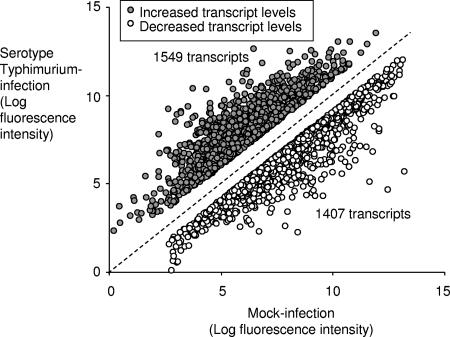
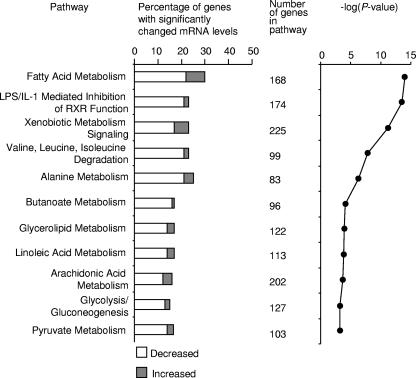
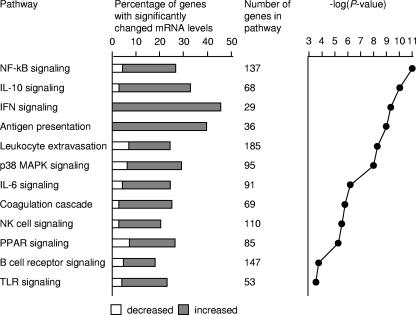
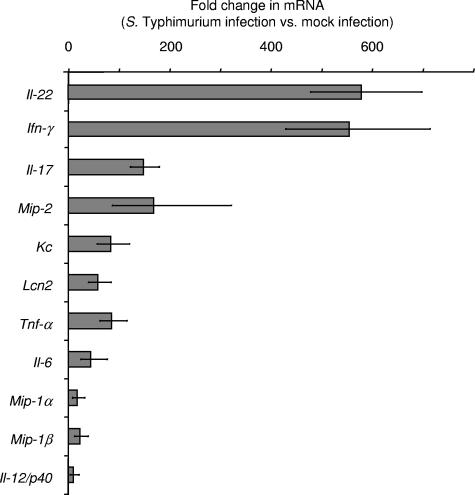
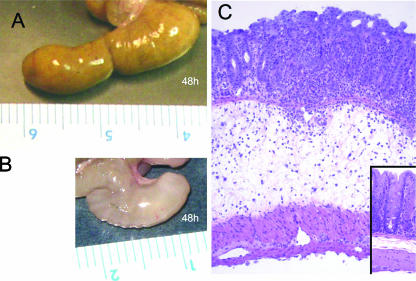
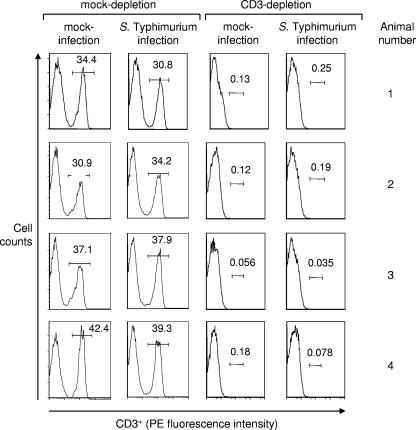
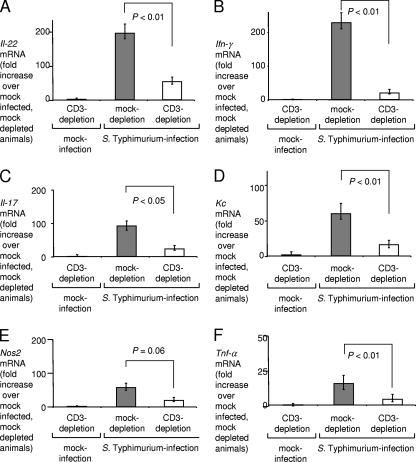
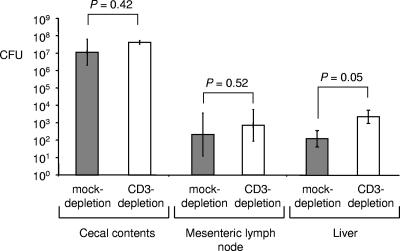
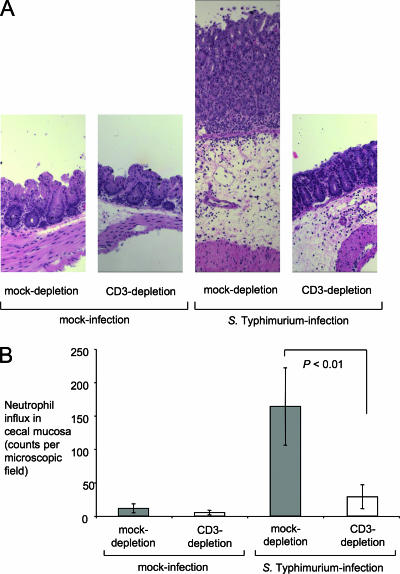
Salmonella enterica serotype Typhimurium causes an acute inflammatory reaction in the ceca of streptomycin-pretreated mice. We determined global changes in gene expression elicited by serotype Typhimurium in the cecal mucosa. The gene expression profile was dominated by T-cell-derived cytokines and genes whose expression is known to be induced by these cytokines. Markedly increased mRNA levels of genes encoding gamma interferon (IFN-gamma), interleukin-22 (IL-22), and IL-17 were detected by quantitative real-time PCR. Furthermore, the mRNA levels of genes whose expression is induced by IFN-gamma, IL-22, or IL-17, including genes encoding macrophage inflammatory protein 2 (MIP-2), inducible nitric oxide synthase (Nos2), lipocalin-2 (Lcn2), MIP-1alpha, MIP-1beta, and keratinocyte-derived cytokine (KC), were also markedly increased. To assess the importance of T cells in orchestrating this proinflammatory gene expression profile, we depleted T cells by using a monoclonal antibody prior to investigating cecal inflammation caused by serotype Typhimurium in streptomycin-pretreated mice. Depletion of CD3+ T cells resulted in a dramatic reduction in gross pathology, a significantly reduced recruitment of neutrophils, and a marked reduction in mRNA levels of Ifn-gamma, Il-22, Il-17, Nos2, Lcn2, and Kc. Our results suggest that T cells play an important role in amplifying inflammatory responses induced by serotype Typhimurium in the cecal mucosa.


Figures

FIG. 1.
FIG. 1.
Time course of cytokine responses in the ceca of streptomycin-pretreated mice during serotype Typhimurium infection. For each time point, changes in gene expression observed for serotype Typhimurium-infected mice (n = 4) compared to that observed for mock-infected mice (n = 4) were determined. The graph shows geometric means of increases (n-fold) in Mip-2, Kc, Il-6, Tnf-α, Il23p19, and Il-10 expression over time.
FIG. 2.
FIG. 2.
Serotype Typhimurium-induced increases and decreases in mRNA levels in the cecal mucosa. The graph shows the changes in expression for genes whose transcript levels were significantly increased (n = 1,549) or decreased (n = 1,407) 48 h after serotype Typhimurium infection compared to levels after mock infection.
FIG. 3.
FIG. 3.
Gene expression profile of transcripts that were significantly decreased in the cecal mucosa during serotype Typhimurium infection. Biological analysis of microarray data was performed using the Affymetrix NetAFFX web interface and the DAVID (http://david.abcc.ncifcrf.gov/) annotation tool. Statistically overrepresented (P < 0.05) biological processes within subclusters were identified using EASE (http://david.abcc.ncifcrf.gov/). Biological processes that were significantly overrepresented among decreased transcripts are indicated. LPS, lipopolysaccharide; RXR, retinoid X receptor.
FIG. 4.
FIG. 4.
Gene expression profile of transcripts that were significantly increased in the cecal mucosa during serotype Typhimurium infection. Biological analysis of microarray data was performed using the Affymetrix NetAFFX web interface and the DAVID (http://david.abcc.ncifcrf.gov/) annotation tool. Statistically overrepresented (P < 0.05) biological processes within subclusters were identified using EASE (http://david.abcc.ncifcrf.gov/). Biological processes that were significantly overrepresented among increased transcripts are indicated. MAPK, mitogen-activated protein kinase; PPAR, peroxisome proliferator-activated receptor; TLR, Toll-like receptor.
FIG. 5.
FIG. 5.
Cytokine expression elicited by serotype Typhimurium in streptomycin-pretreated mice 48 h after infection, as measured by quantitative real-time PCR. Changes in gene expression observed for serotype Typhimurium-infected mice (n = 4) compared to that observed for mock-infected mice (n = 4) were determined. Data are shown as geometric means of changes (n-fold) ± standard errors, determined for RNA from individual mice.
FIG. 6.
FIG. 6.
Gross pathological (A and B) and histopathological (C) appearance of the murine cecum. (A) Cecum of a streptomycin-pretreated mouse 48 h after inoculation with sterile LB broth, with a normal appearance. (B) Cecum of a streptomycin-pretreated mouse 48 h after inoculation with serotype Typhimurium. Note the reduced size of the cecum, which was devoid of contents and had a whitish discoloration and gelatinous appearance, indicating severe edema. (C) Murine cecum 48 h after infection with serotype Typhimurium, shown at low magnification (×10) to illustrate edema in the submucosa. The inset at the bottom right shows a section of the cecum from an animal 48 h after inoculation with sterile LB broth at the same magnification (×10).
FIG. 7.
FIG. 7.
Fractions of T cells present in splenocyte populations of mice (n = 8) treated with anti-mouse CD3 MAb (CD3 depletion) or mice (n = 8) treated with nonspecific IgG antibody (mock depletion). Four mock-depleted and four CD3-depleted mice were infected with serotype Typhimurium, while the remaining animals were mock infected. Splenocytes were isolated 48 h after infection, and cells were analyzed by flow cytometry. The number in each box indicates the fraction of cells within the lymphocyte population that was scored CD3+. PE, phycoerythrin.
FIG. 8.
FIG. 8.
Changes in gene expression elicited 48 h after serotype Typhimurium infection in the cecal mucosa of mock-depleted mice (filled bars) or CD3-depleted mice (open bars), as measured by quantitative real-time PCR. Data are expressed as changes of mRNA levels over mRNA levels detected in mock-infected, mock-depleted mice. Data represent geometric means ± standard errors. Statistical significance of differences is indicated by P values.
FIG. 9.
FIG. 9.
Recovery of serotype Typhimurium from the organs of mock-depleted mice (filled bars) or CD3-depleted mice (open bars). Bars represent geometric means ± standard errors of CFU/organ (cecal contents) or CFU/g tissue (mesenteric lymph node and liver). Statistical significance of differences is indicated by P values.
FIG. 10.
FIG. 10.
Effect of CD3 depletion on the histopathology of the murine cecum 48 h after infection with serotype Typhimurium. (A) All panels are shown at the same magnification (×10) to illustrate the magnitude of edema in serotype Typhimurium-infected animals. The two panels on the left show the normal appearance of the cecal mucosa in mock-infected animals. The second panel from the right shows the cecum of a mock-depleted animal 48 h after serotype Typhimurium infection. Note the marked thickening of the intestinal wall due to edema in the submucosa. The right panel shows the appearance of the cecal mucosa in a CD3-depleted animal 48 h after serotype Typhimurium infection. (B) Neutrophil recruitment into the cecal mucosa. The numbers of neutrophils per microscopic field were determined by a veterinary pathologist during a blind examination of slides from the cecal mucosa. Data represent means ± standard errors. Statistical significance of differences is indicated by P values.

References

    1. Barthel, M., S. Hapfelmeier, L. Quintanilla-Martínez, M. Kremer, M. Rohde, M. Hogardt, K. Pfeffer, H. Russmann, and W.-D. Hardt. 2003. Pretreatment of mice with streptomycin provides a Salmonella enterica serovar Typhimurium colitis model that allows analysis of both pathogen and host. Infect. Immun. 712839-2858. - PMC - PubMed
    1. Chen, L. M., S. Hobbie, and J. E. Galán. 1996. Requirement of cdc42 for salmonella-induced cytoskeletal and nuclear responses. Science 2742115-2118. - PubMed
    1. Day, D. W., B. K. Mandal, and B. C. Morson. 1978. The rectal biopsy appearances in Salmonella colitis. Histopathology 2117-131. - PubMed
    1. D'Orazio, S. E., M. J. Troese, and M. N. Starnbach. 2006. Cytosolic localization of Listeria monocytogenes triggers an early IFN-gamma response by CD8+ T cells that correlates with innate resistance to infection. J. Immunol. 1777146-7154. - PubMed
    1. Dubin, P. J., and J. K. Kolls. 2007. IL-23 mediates inflammatory responses to mucoid Pseudomonas aeruginosa lung infection in mice. Am. J. Physiol. Lung Cell Mol. Physiol. 292L519-L528. - PMC - PubMed

Publication types

MeSH terms

Associated data