Calcium-dependent inactivation terminates calcium release in skeletal muscle of amphibians
- PMID: 18347079
- PMCID: PMC2279174
- DOI: 10.1085/jgp.200709870
Calcium-dependent inactivation terminates calcium release in skeletal muscle of amphibians
Abstract
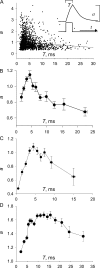
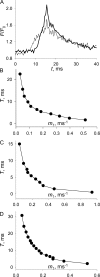
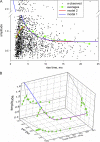
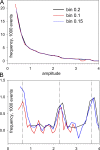
In skeletal muscle of amphibians, the cell-wide cytosolic release of calcium that enables contraction in response to an action potential appears to be built of Ca2+ sparks. The mechanism that rapidly terminates this release was investigated by studying the termination of Ca2+ release underlying sparks. In groups of thousands of sparks occurring spontaneously in membrane-permeabilized frog muscle cells a complex relationship was found between amplitude a and rise time T, which in sparks corresponds to the active time of the underlying Ca2+ release. This relationship included a range of T where a paradoxically decreased with increasing T. Three different methods were used to estimate Ca2+ release flux in groups of sparks of different T. Using every method, it was found that T and flux were inversely correlated, roughly inversely proportional. A simple model in which release sources were inactivated by cytosolic Ca2+ was able to explain the relationship. The predictive value of the model, evaluated by analyzing the variance of spark amplitude, was found to be high when allowance was made for the out-of-focus error contribution to the total variance. This contribution was estimated using a theory of confocal scanning (Ríos, E., N. Shirokova, W.G. Kirsch, G. Pizarro, M.D. Stern, H. Cheng, and A. González. Biophys. J. 2001. 80:169-183), which was confirmed in the present work by simulated line scanning of simulated sparks. Considering these results and other available evidence it is concluded that Ca2+-dependent inactivation, or CDI, provides the crucial mechanism for termination of sparks and cell-wide Ca2+ release in amphibians. Given the similarities in kinetics of release termination observed in cell-averaged records of amphibian and mammalian muscle, and in spite of differences in activation mechanisms, CDI is likely to play a central role in mammals as well. Trivially, an inverse proportionality between release flux and duration, in sparks or in global release of skeletal muscle, maintains constancy of the amount of released Ca2+.
Figures


Similar articles
-
The changes in Ca2+ sparks associated with measured modifications of intra-store Ca2+ concentration in skeletal muscle.J Gen Physiol. 2006 Jul;128(1):45-54. doi: 10.1085/jgp.200609545. Epub 2006 Jun 12. J Gen Physiol. 2006. PMID: 16769796 Free PMC article.
-
A repetitive mode of activation of discrete Ca2+ release events (Ca2+ sparks) in frog skeletal muscle fibres.J Physiol. 1999 Mar 1;515 ( Pt 2)(Pt 2):391-411. doi: 10.1111/j.1469-7793.1999.391ac.x. J Physiol. 1999. PMID: 10050007 Free PMC article.
-
Simulation of calcium sparks in cut skeletal muscle fibers of the frog.J Gen Physiol. 2003 Apr;121(4):311-24. doi: 10.1085/jgp.200308787. Epub 2003 Mar 17. J Gen Physiol. 2003. PMID: 12642597 Free PMC article.
-
Initiation and termination of calcium sparks in skeletal muscle.Front Biosci. 2002 May 1;7:d1212-22. doi: 10.2741/A834. Front Biosci. 2002. PMID: 11991854 Review.
-
Ca2+ sparks in skeletal muscle.Prog Biophys Mol Biol. 2006 Nov;92(3):308-32. doi: 10.1016/j.pbiomolbio.2005.05.016. Epub 2005 Jul 1. Prog Biophys Mol Biol. 2006. PMID: 16125755 Review.
Cited by
-
CGP-37157 inhibits the sarcoplasmic reticulum Ca²+ ATPase and activates ryanodine receptor channels in striated muscle.Mol Pharmacol. 2011 Jan;79(1):141-7. doi: 10.1124/mol.110.067165. Epub 2010 Oct 5. Mol Pharmacol. 2011. PMID: 20923851 Free PMC article.
-
Dynamic local changes in sarcoplasmic reticulum calcium: physiological and pathophysiological roles.J Mol Cell Cardiol. 2012 Feb;52(2):304-11. doi: 10.1016/j.yjmcc.2011.06.024. Epub 2011 Jul 13. J Mol Cell Cardiol. 2012. PMID: 21767546 Free PMC article. Review.
-
A reappraisal of the Ca2+ dependence of fast inactivation of Ca2+ release in frog skeletal muscle.J Muscle Res Cell Motil. 2010 Aug;31(2):81-92. doi: 10.1007/s10974-010-9212-y. Epub 2010 Jun 11. J Muscle Res Cell Motil. 2010. PMID: 20544260
-
Quantal Properties of Voltage-Dependent Ca2+ Release in Frog Skeletal Muscle Persist After Reduction of [Ca2+] in the Sarcoplasmic Reticulum.J Membr Biol. 2024 Apr;257(1-2):37-50. doi: 10.1007/s00232-024-00309-0. Epub 2024 Mar 9. J Membr Biol. 2024. PMID: 38460011
-
Ca2+ inactivation of the mammalian ryanodine receptor type 1 in a lipidic environment revealed by cryo-EM.Elife. 2022 Mar 8;11:e75568. doi: 10.7554/eLife.75568. Elife. 2022. PMID: 35257661 Free PMC article.
References
-
- Baylor, S.M. 2005. Calcium sparks in skeletal muscle fibers. Cell Calcium. 37:513–530. - PubMed
Publication types
MeSH terms
Substances
Grants and funding
LinkOut - more resources
Full Text Sources
Miscellaneous

