. 2008 May;18(5):706-16.
doi: 10.1101/gr.074914.107. Epub 2008 Mar 17.

A gene expression network model of type 2 diabetes links cell cycle regulation in islets with diabetes susceptibility

Affiliations

A gene expression network model of type 2 diabetes links cell cycle regulation in islets with diabetes susceptibility

Mark P Keller et al. Genome Res. 2008 May.

Abstract

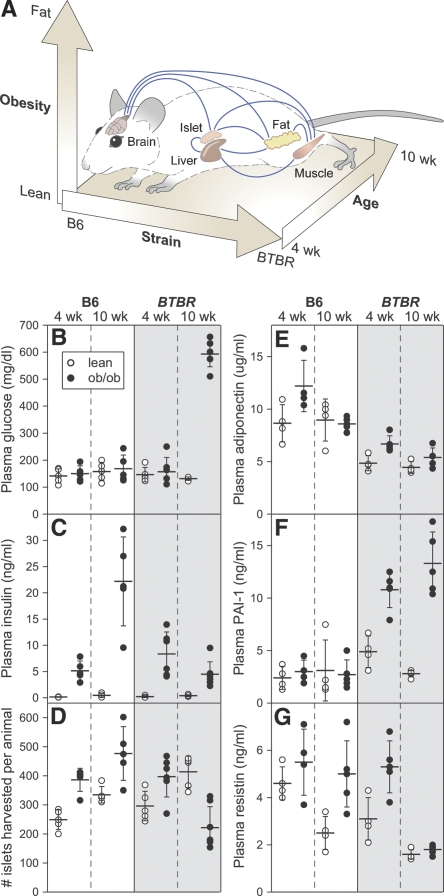
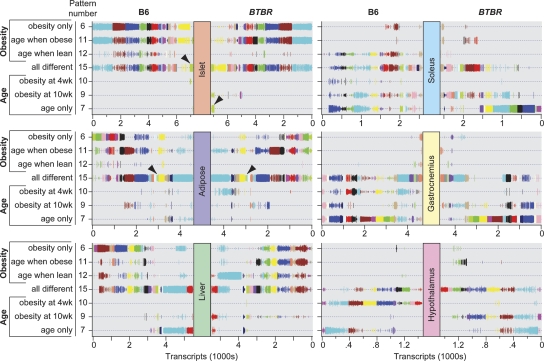
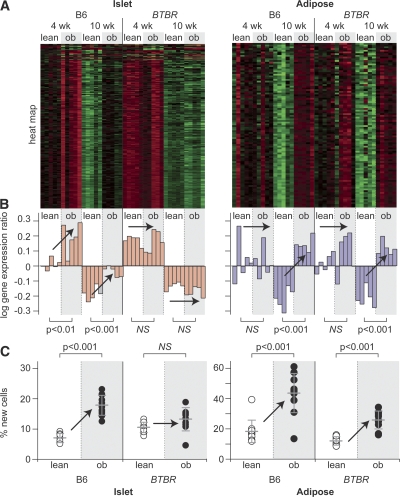
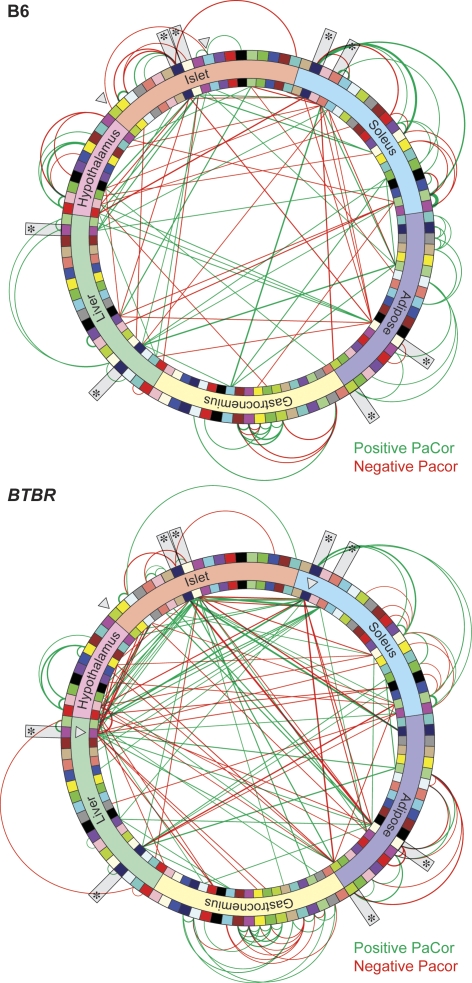
Insulin resistance is necessary but not sufficient for the development of type 2 diabetes. Diabetes results when pancreatic beta-cells fail to compensate for insulin resistance by increasing insulin production through an expansion of beta-cell mass or increased insulin secretion. Communication between insulin target tissues and beta-cells may initiate this compensatory response. Correlated changes in gene expression between tissues can provide evidence for such intercellular communication. We profiled gene expression in six tissues of mice from an obesity-induced diabetes-resistant and a diabetes-susceptible strain before and after the onset of diabetes. We studied the correlation structure of mRNA abundance and identified 105 co-expression gene modules. We provide an interactive gene network model showing the correlation structure between the expression modules within and among the six tissues. This resource also provides a searchable database of gene expression profiles for all genes in six tissues in lean and obese diabetes-resistant and diabetes-susceptible mice, at 4 and 10 wk of age. A cell cycle regulatory module in islets predicts diabetes susceptibility. The module predicts islet replication; we found a strong correlation between (2)H(2)O incorporation into islet DNA in vivo and the expression pattern of the cell cycle module. This pattern is highly correlated with that of several individual genes in insulin target tissues, including Igf2, which has been shown to promote beta-cell proliferation, suggesting that these genes may provide a link between insulin resistance and beta-cell proliferation.


Figures

Figure 1.
Figure 1.
Ten-week-old BTBR ob mice are severely diabetic. (A) Schematic representation of experimental model depicting a gene expression network connecting key tissues in a mouse when examined over three primary axes: obesity, strain, and age. Clinical phenotypes are shown for five to seven animals for each of the eight groups of mice used for study. Plasma glucose (B), insulin (C), total number of islets harvested per pancreas (D), adiponectin (E), PAI-1 (F), and resistin (G) are plotted. Open (lean) and closed (ob/ob) circles represent individual mice. Horizontal bars show mean values for each group (±SD).
Figure 2.
Figure 2.
Co-expression modules can be deconstructed to show strain-dependent changes in transcript expression patterns. The strain-specific expression pattern for each co-expression module is illustrated for all six tissues profiled. The color of a particular module within one tissue is not related to that same color for a module of another tissue but is preserved across strains. The vertical size of the lines used to illustrate the module transcripts is proportional to the strain-specific posterior probability determination illustrated in Supplemental Figure S1. A decrease in the size of the symbols is evident in the hypothalamus compared to the other tissues, reflecting the decreased posterior probability cutoff (0.5) that was used for DE transcript identification in hypothalamus. For each strain and all tissues, every transcript has a unique expression pattern. Filled arrowheads highlight the cell cycle regulatory modules in islet and adipose tissue. Strain-dependent differences in expression pattern are evident when the pattern distribution for a particular color-coded module is shifted in the two strains. For example, the cell cycle regulatory gene set in islets largely shifts from pattern 15 in B6 to pattern 7 in BTBR (see arrowheads). This figure is hyperlinked to our microarray gene expression database at http://diabetes.wisc.edu/kelleretal2008/fig2.php.
Figure 3.
Figure 3.
Co-expression modules enriched with cell cycle regulation accurately predict diabetes and obesity. Expression heat maps (A) and the PC1 on log10 scale (B) of the cell cycle regulatory modules in islets (217 transcripts) and adipose (96 transcripts) are shown. For the heat maps, red shows increased expression, green shows decreased expression, and black is neutral. Bar plots in B show the PC1 for individual mice and correspond to an expressed decrease for negative values and increased expression for positive values. The percentage of new cells, derived from an in vivo measure of 2H incorporation into newly synthesized DNA, is shown for islets and adipose tissue (C). Where significant obesity-dependent differences were observed, P-values are shown. Arrows are used to show influence of obesity. NS, not significant.
Figure 4.
Figure 4.
A gene-gene network model is distinct between B6 and BTBR mice. A gene-gene network was constructed based on the PaCor between the strain-specific PC1 calculated between all modules identified in the six tissues profiled. Modules are illustrated as colored bricks along the inside and outside of the network wheels and preserve the color scheme illustrated in Figure 2. Inter-tissue edges within the network are shown as lines connecting inside modules; intra-tissue edges are depicted as arcs connecting the outside modules. The cell cycle regulatory module in islet and those modules that form a direct connection to the cell cycle islet module are highlighted with open arrowheads. Network hot spots are indicated with asterisks. Line thickness is proportional to the magnitude of the PaCor, which ranged from 0.487 to 0.093 in B6 and from 0.303 to 0.086 in BTBR, for maximum and minimum, respectively. Positive predictive values for edge accuracy, obtained from simulations (see Methods), were on average 78% in B6 and 77% in BTBR. Red, negative PaCor; green, positive PaCor. Significance is set to control FDR at 0.5%. This figure is hyperlinked to our microarray gene expression database at http://diabetes.wisc.edu/kelleretal2008/fig4.php.

References

    1. Brennand K., Huangfu D., Melton D., Huangfu D., Melton D., Melton D. All beta cells contribute equally to islet growth and maintenance. PLoS Biol. 2007;5:e163. doi: 10.1371/journal.pbio.0050163. - DOI - PMC - PubMed
    1. Burcelin R., Mrejen C., Decaux J.F., De Mouzon S.H., Girard J., Charron M.J., Mrejen C., Decaux J.F., De Mouzon S.H., Girard J., Charron M.J., Decaux J.F., De Mouzon S.H., Girard J., Charron M.J., De Mouzon S.H., Girard J., Charron M.J., Girard J., Charron M.J., Charron M.J. In vivo and in vitro regulation of hepatic glucagon receptor mRNA concentration by glucose metabolism. J. Biol. Chem. 1998;273:8088–8093. - PubMed
    1. Busch R., Cesar D., Higuera-Alhino D., Gee T., Hellerstein M.K., McCune J.M., Cesar D., Higuera-Alhino D., Gee T., Hellerstein M.K., McCune J.M., Higuera-Alhino D., Gee T., Hellerstein M.K., McCune J.M., Gee T., Hellerstein M.K., McCune J.M., Hellerstein M.K., McCune J.M., McCune J.M. Isolation of peripheral blood CD4+ T cells using RosetteSep and MACS for studies of DNA turnover by deuterium labeling. J. Immunol. Methods. 2004;286:97–109. - PubMed
    1. Carlson M.R., Zhang B., Fang Z., Mischel P.S., Horvath S., Nelson S.F., Zhang B., Fang Z., Mischel P.S., Horvath S., Nelson S.F., Fang Z., Mischel P.S., Horvath S., Nelson S.F., Mischel P.S., Horvath S., Nelson S.F., Horvath S., Nelson S.F., Nelson S.F. Gene connectivity, function, and sequence conservation: Predictions from modular yeast co-expression networks. BMC Genomics. 2006;7:40. doi: 10.1186/1471-2164-7-40. - DOI - PMC - PubMed
    1. Cozar-Castellano I., Fiaschi-Taesch N., Bigatel T.A., Takane K.K., Garcia-Ocana A., Vasavada R., Stewart A.F., Fiaschi-Taesch N., Bigatel T.A., Takane K.K., Garcia-Ocana A., Vasavada R., Stewart A.F., Bigatel T.A., Takane K.K., Garcia-Ocana A., Vasavada R., Stewart A.F., Takane K.K., Garcia-Ocana A., Vasavada R., Stewart A.F., Garcia-Ocana A., Vasavada R., Stewart A.F., Vasavada R., Stewart A.F., Stewart A.F. Molecular control of cell cycle progression in the pancreatic beta-cell. Endocr. Rev. 2006;27:356–370. - PubMed

Publication types

MeSH terms

Associated data