. 2008 Mar 18;105(11):4405-10.
doi: 10.1073/pnas.0707646105. Epub 2008 Mar 17.

Increased amphetamine-induced hyperactivity and reward in mice overexpressing the dopamine transporter

Affiliations

Increased amphetamine-induced hyperactivity and reward in mice overexpressing the dopamine transporter

Ali Salahpour et al. Proc Natl Acad Sci U S A. .

Abstract

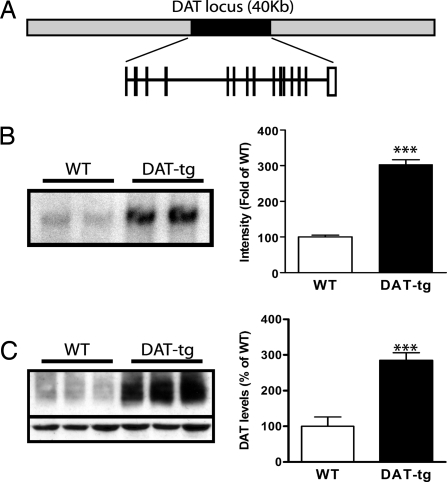
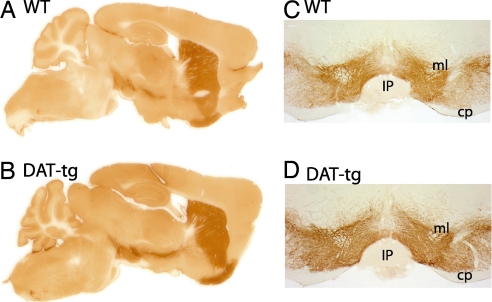
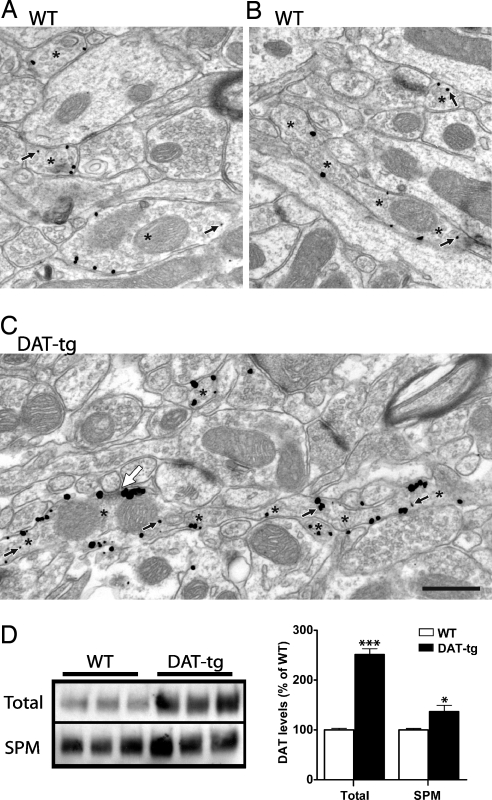
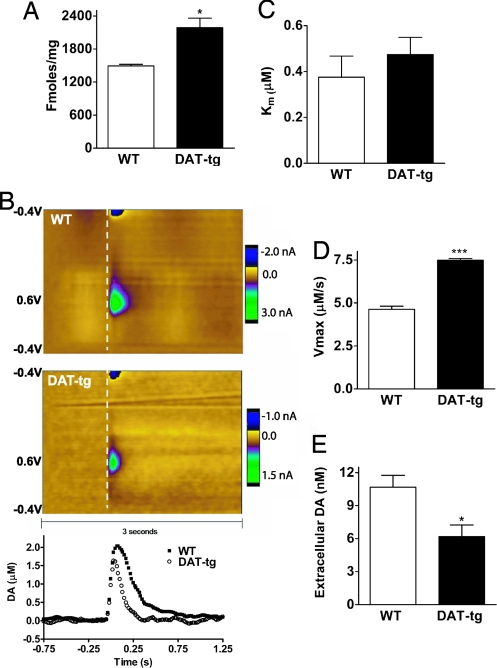
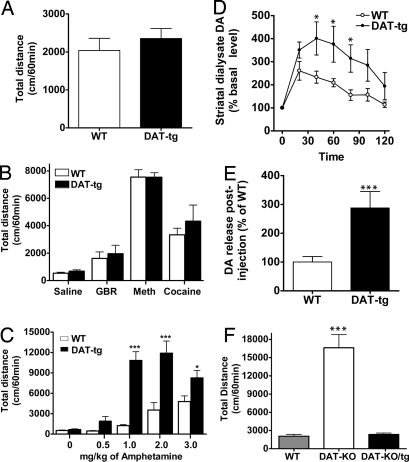
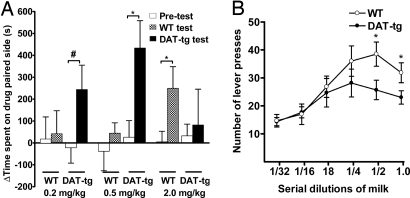
The dopamine transporter (DAT) plays a key role in the regulation of dopaminergic signaling wherein it controls both the spatial and temporal actions of dopamine. Here we evaluated the behavioral and neurochemical consequences of increased DAT function by generating DAT transgenic mice (DAT-tg) that overexpress the transporter. These mice were generated by pronuclear injection of a bacterial artificial chromosome containing the mouse DAT locus, yielding an anatomical expression pattern of DAT-tg identical to WT. In DAT-tg mice there is a 3-fold increase in the levels of total and membrane-expressed DAT, but synaptic plasma membrane fractions of DAT-tg mice show only a 30% increase in transporter levels. Functional studies reveal that in the DAT-tg animals there is a 50% increase in the rate of dopamine (DA) uptake resulting in extracellular levels of DA that are decreased by approximately 40%. Behaviorally, DAT-tg animals display similar locomotor stimulation when treated with DAT blockers such as GBR12909, methylphenidate, and cocaine. However, these mice demonstrate markedly increased locomotor responses to amphetamine compared with WT animals. Furthermore, compared with controls, there is a 3-fold greater increase in the amount of DA released by amphetamine in DAT-tg mice that correlates with the 3-fold increase in protein expression. Finally, DAT-tg animals show reduced operant responding for natural reward while displaying preference for amphetamine at much lower doses (0.2 and 0.5 mg/kg) than WT mice (2 mg/kg). These results suggest that overexpression of DAT leads to a marked increase in sensitivity to psychomotor and rewarding properties of amphetamine.


Conflict of interest statement

The authors declare no conflict of interest.

Figures

Fig. 1.
Fig. 1.
Generation of DAT-tg animals. (A) Schematic representation of the BAC clone used for the generation of the DAT-tg animals. (B) Representative DAT Southern blot analysis from WT and DAT-tg animals. Data are means ± SEM (four per group). (C) Representative DAT Western blot analysis of striatal tissue from WT and DAT-tg animals. Data are means ± SEM (five per group). ***, P < 0.001.
Fig. 2.
Fig. 2.
Immunohistochemical localization of DAT. Saggital sections (A and B) and coronal sections (C and D) of WT and DAT-tg show the expression pattern of DAT by immunoperoxidase labeling. cp, cerebral peduncle; IP, intrapeduncular nucleus; ml, medial lemniscus.
Fig. 3.
Fig. 3.
Subcellular localization of DAT by electron microscopy and membrane fractionation. Dorsal striatum of WT (A and B) and DAT-tg (C) mice show the density of Immunogold–silver labeling for DAT. Immunoreactive axons are identified by asterisks, with two profiles cut longitudinally indicated by multiple asterisks (B and C). Small black arrows indicate cytoplasmic gold particles; all other gold particles are associated with the plasma membrane. The large white arrow shows a synapse formed by the longitudinally sectioned axon most likely onto the neck of a spine. Immunoreactivity for DAT occurs in a perisynaptic location. (Scale bar: 500 nm.) (D) Representative DAT Western blot analysis of total or synaptic plasma membrane fractions from WT and DAT-tg animals. Data are means ± SEM (six per group in duplicates). *, P < 0.05; ***, P < 0.001.
Fig. 4.
Fig. 4.
Analysis of DAT function. (A) Levels of DAT determined by 3[H]WIN 35428 radioligand binding. (B) Release and clearance of DA measured by FSCV in striatal slices from WT and DAT-tg animals after a single-pulse stimulation. The color plot topographically depicts the voltammetric data, with time on x axis, applied scan potential on the y axis, and background-subtracted current measured on the z axis in pseudocolor (27). The white dashed line denotes the location of the stimulation. (Bottom) Dopamine concentrations obtained every 16 ms over a 2-s interval where traces monitor the release (ascending curve) and reuptake (descending curve) of DA. (C) Km values of WT and DAT-tg animals for DA determined by FSCV. Data are means ± SEM (n = 4 per group). (D) Uptake rates (Vmax) of DAT for DA in WT and DAT-tg animals measured by FSCV. Data are means ± SEM (n = 4 per group). (E) Extracellular levels of DA in the striatum of freely moving WT (n = 4) and DAT-tg (n = 7) mice as determined by quantitative low-perfusion-rate microdialysis. Data are means ± SEM. *, P < 0.05; ***, P < 0.001.
Fig. 5.
Fig. 5.
Locomotor analysis. (A) Basal locomotion of WT and DAT-tg animals as measured by total distance over a 60-min period. Data are means ± SEM (n = 8 per group). (B) Total distance traveled during 60 min after i.p. injection of GBR12909 (10 mg/kg), methylphenidate (20 mg/kg), and cocaine (20 mg/kg) to WT and DAT-tg animals that were habituated for 60 min. Data are means ± SEM (n = 8 per group). (C) Total distance traveled during 60 min after i.p. injection of amphetamine to WT and DAT-tg animals that were habituated for 60 min. Data are means ± SEM (n = 8 per group). (D) Extracellular striatal DA dynamics in WT and DAT-tg mice as determined by conventional microdialysis after i.p. injection of amphetamine (3 mg/kg) to animals. Data are presented as percentage of average level of DA measured in at least three samples collected before the drug administration. Data are means ± SEM (n = 5–8 per group). (E) Calculation of the fold increase in DA release after amphetamine injection in WT and DAT-tg animals. Data are means ± SEM (n = 5–8 per group). (F) Basal locomotor activity of WT, DAT-KO, and crosses between DAT-KO and DAT-tg animals (DAT-KO/tg) as measured by total distance over a 60-min period in the open field. Data are means ± SEM (n = 5–8 per group). *, P < 0.05; ***, P < 0.001.
Fig. 6.
Fig. 6.
Responsiveness of DAT-tg animals to psychostimulant and natural rewards. (A) Amphetamine-induced CPP in WT and DAT-tg animals. CPP was performed as described in Materials and Methods. Data are shown as the difference in the time spent in the amphetamine-associated chamber vs. the saline-associated chamber on the test day and the preconditioning day. Data are means ± SEM (n = 7–12 animals). *, P < 0.05; #, P < 0.062. (B) Results of operant responding of WT and DAT-tg animals for sweet liquid reward. The experiments were conducted as described in Materials and Methods. Shown are the number of lever presses during the first 15 min for WT and DAT-tg animals (six per group) for different dilutions of sweetened condensed milk.

References

    1. Molinoff PB, Axelrod J. Biochemistry of catecholamines. Annu Rev Biochem. 1971;40:465–500. - PubMed
    1. Hornykiewicz O. Biochemical aspects of Parkinson's disease. Neurology. 1998;51(2) Suppl 2:S2–S9. - PubMed
    1. Carlsson A. A paradigm shift in brain research. Science. 2001;294:1021–1024. - PubMed
    1. Gainetdinov RR, Caron MG. Monoamine transporters: From genes to behavior. Annu Rev Pharmacol Toxicol. 2003;43:261–284. - PubMed
    1. Hahn MK, Blakely RD. The functional impact of SLC6 transporter genetic variation. Annu Rev Pharmacol Toxicol. 2007;47:401–441. - PubMed

Publication types

Substances

LinkOut - more resources