. 2008 Mar 12;3(3):e1751.
doi: 10.1371/journal.pone.0001751.

Automatic physiological waveform processing for FMRI noise correction and analysis

Affiliations

Automatic physiological waveform processing for FMRI noise correction and analysis

Daniel J Kelley et al. PLoS One. .

Abstract

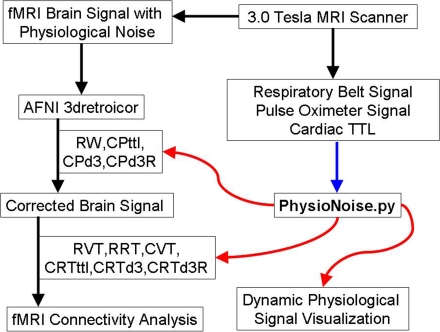
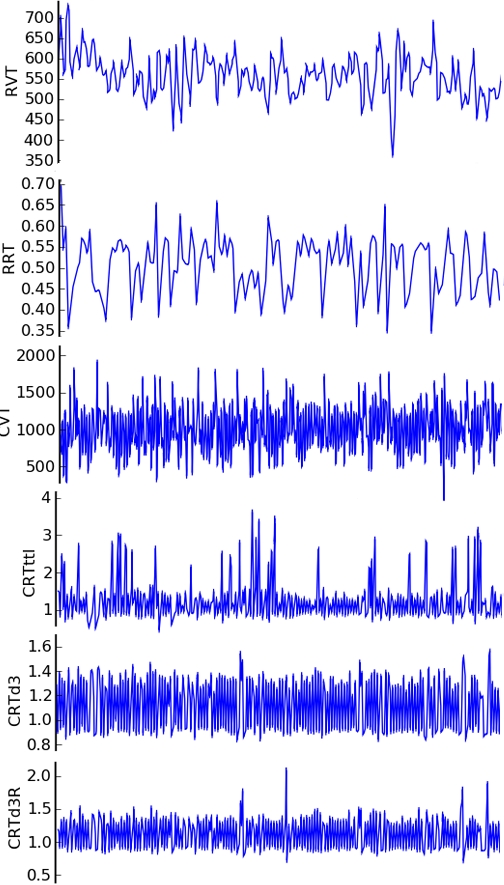
Functional MRI resting state and connectivity studies of brain focus on neural fluctuations at low frequencies which share power with physiological fluctuations originating from lung and heart. Due to the lack of automated software to process physiological signals collected at high magnetic fields, a gap exists in the processing pathway between the acquisition of physiological data and its use in fMRI software for both physiological noise correction and functional analyses of brain activation and connectivity. To fill this gap, we developed an open source, physiological signal processing program, called PhysioNoise, in the python language. We tested its automated processing algorithms and dynamic signal visualization on resting monkey cardiac and respiratory waveforms. PhysioNoise consistently identifies physiological fluctuations for fMRI noise correction and also generates covariates for subsequent analyses of brain activation and connectivity.


Conflict of interest statement

Competing Interests: The authors have declared that no competing interests exist.

Figures

Figure 1
Figure 1. PhysioNoise Fills Physiological Signal Processing Gap.
PhysioNoise processes physiological noise signals for existing software (AFNI) used in retrospective fMRI physiological noise correction and connectivity analyses. The inputs to PhysioNoise are represented by the blue arrow and the outputs from PhysioNoise are identified with the red arrows. (RW = Downsampled respiratory spline waveform; CPttl = Cardiac peak based on the TTL pulse from the scanner; CPd3 = Cardiac peak based on trough of the third derivative; CPd3R = Cardiac peak R-wave estimate based on small peak of third derivative preceding the CPd3; RVT = Respiratory volume over time based on peakdet peaks; RRT = Respiratory rate over time; CVT = Cardiac volume over time based on peakdet peaks; CRTttl = Cardiac rate over time based on the TTL pulse from the scanner; CRTd3 = Cardiac rate over time based on CPd3; CRTd3R = Cardiac rate over time based on CPd3R).
Figure 2
Figure 2. Plot of Physiological Signal Artifact.
The raw respiratory and cardiac waveforms are plotted along with their filtered versions. Signal artifacts with large residuals (Raw Signal-Filtered Signal) are replaced with a spline interpolation. The series of green spline circles are the thick black waveform.
Figure 3
Figure 3. Cardiac Peaks.
The CPpd, CPttl, CPd3, and CPd3R are displayed on the cardiac spline (black) and third derivative (cyan). The envelope of the third derivative peaks is shown in yellow. The plot also shows an example of the scanner TTL error of commission in which an extra CPttl was detected during one cardiac cycle. The differentiation method correctly produced one CPd3 peak (CPttl = Cardiac peak based on the TTL pulse from the scanner; CPd3 = Cardiac peak based on trough of the third derivative; CPd3R = Cardiac peak R-wave estimate based on small peak of third derivative preceding the CPd3).
Figure 4
Figure 4. Respiratory and Cardiac Envelopes.
The peaks identified by peakdet (RPpd,CPpd) are shown along with the respiratory and cardiac waveforms, top envelope, bottom envelope, and the absolute value of their means.
Figure 5
Figure 5. Cardiac and Respiratory Rates and Volumes over Time.
Representative RVT, RRT, CVT, CRTttl, CRTd3, and CRTd3R waveforms are displayed in PhysioNoise. Note that the CRTd3 contains fewer outliers than the CRTttl and the CRTd3R. Dynamic visualization of these curves in PhysioNoise is possible using the zoom and scroll features (RVT = Respiratory volume over time based on peakdet peaks; RRT = Respiratory rate over time; CVT = Cardiac volume over time based on peakdet peaks; CRTttl = Cardiac rate over time based on the TTL pulse from the scanner; CRTd3 = Cardiac rate over time based on CPd3; CRTd3R = Cardiac rate over time based on CPd3R).

References

    1. Biswal B, DeYoe AE, Hyde JS. Reduction of physiological fluctuations in fMRI using digital filters. Magn Reson Med. 1996;35:107–113. - PubMed
    1. Bandettini PA, Wong EC, Hinks RS, Tikofsky RS, Hyde JS. Time course EPI of human brain function during task activation. Magn Reson Med. 1992;25:390–397. - PubMed
    1. Purdon PL, Weisskoff RM. Effect of temporal autocorrelation due to physiological noise and stimulus paradigm on voxel-level false-positive rates in fMRI. Hum Brain Mapp. 1998;6:239–249. - PMC - PubMed
    1. Bharat Biswal FZY, Haughton VictorM, Hyde JamesS. Functional connectivity in the motor cortex of resting human brain using echo-planar mri. Magnetic Resonance in Medicine. 1995;34:537–541. - PubMed
    1. Hu X, Le TH, Parrish T, Erhard P. Retrospective estimation and correction of physiological fluctuation in functional MRI. Magn Reson Med. 1995;34:201–212. - PubMed

Publication types