

Benchmarking implicit solvent folding simulations of the amyloid beta(10-35) fragment
- PMID: 18348560
- PMCID: PMC2719849
- DOI: 10.1021/jp077099h
Benchmarking implicit solvent folding simulations of the amyloid beta(10-35) fragment
Abstract
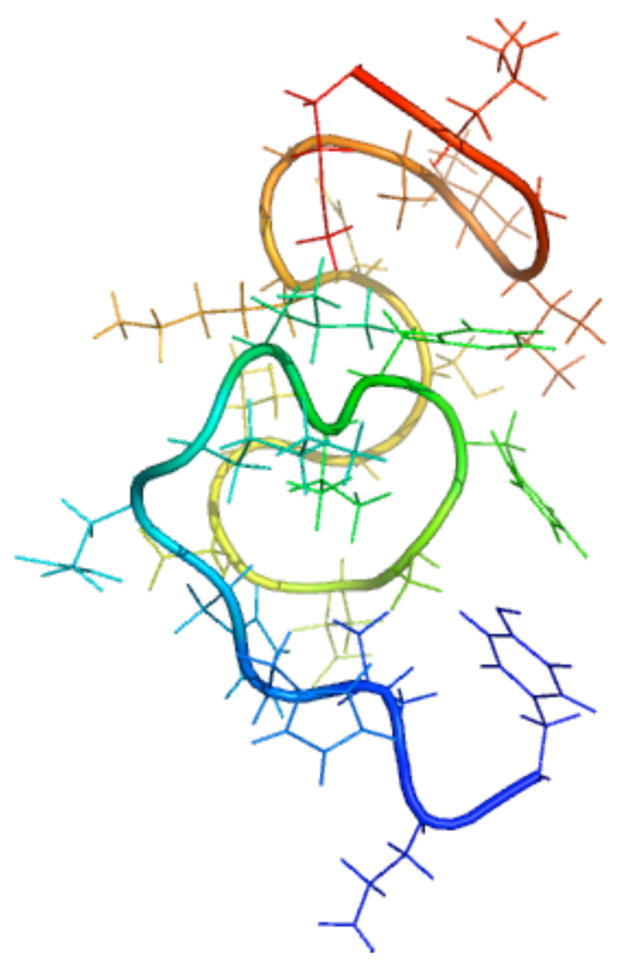
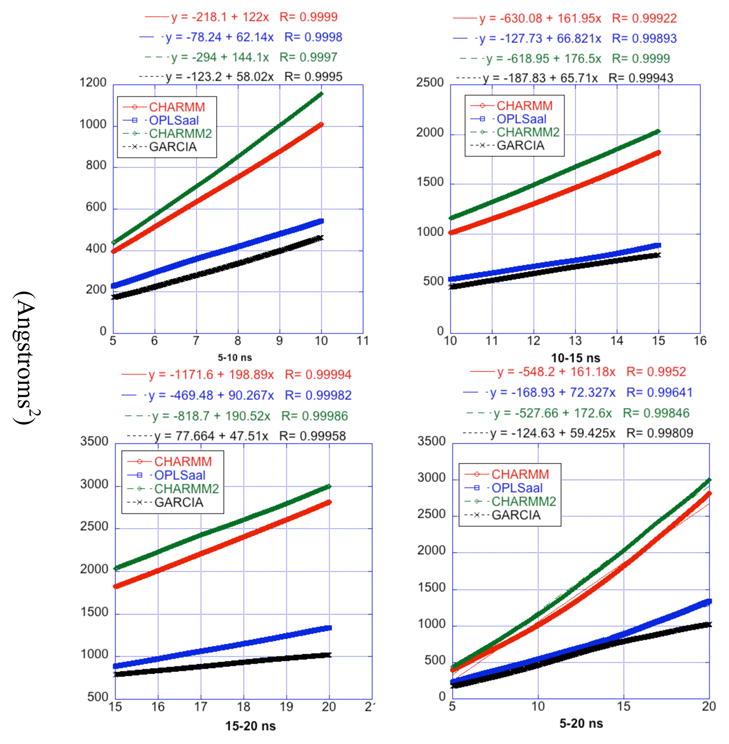
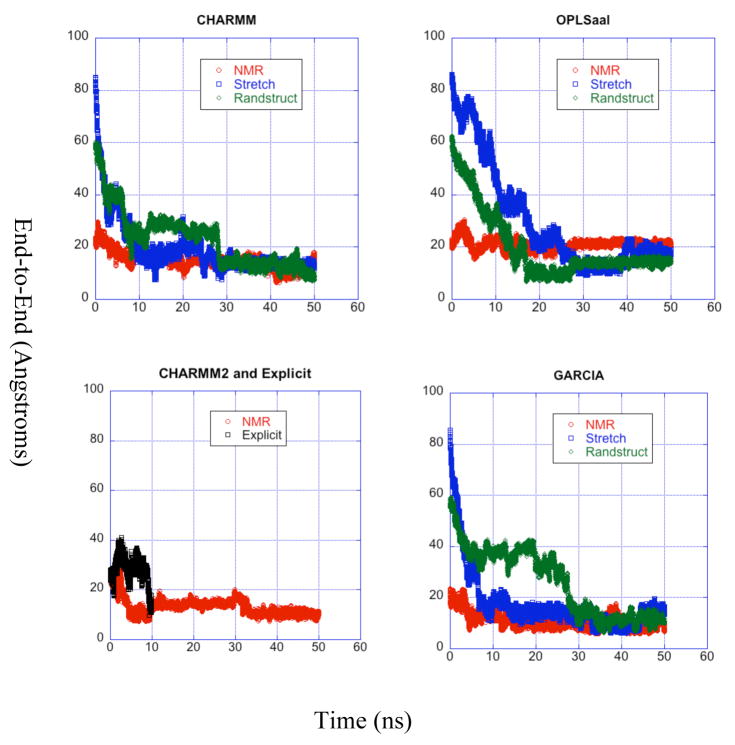
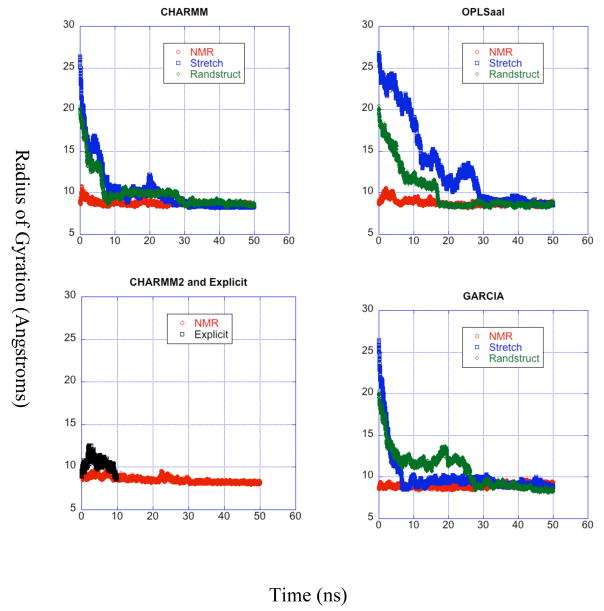
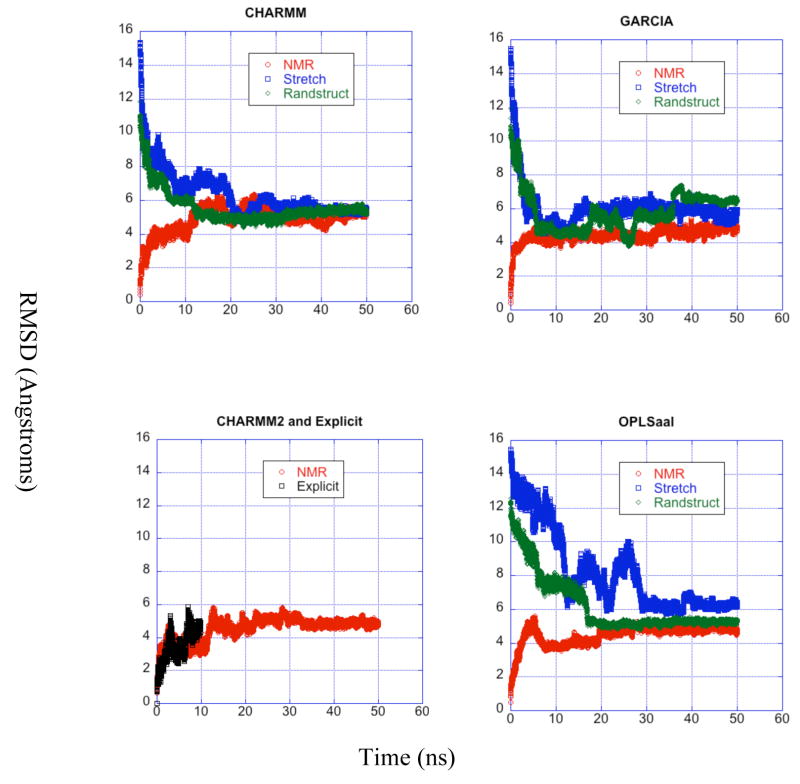
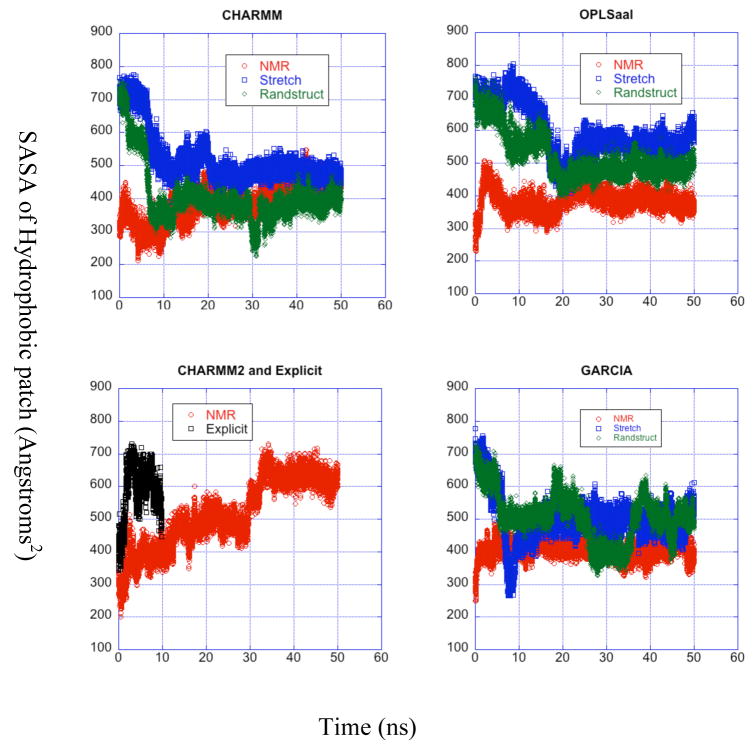
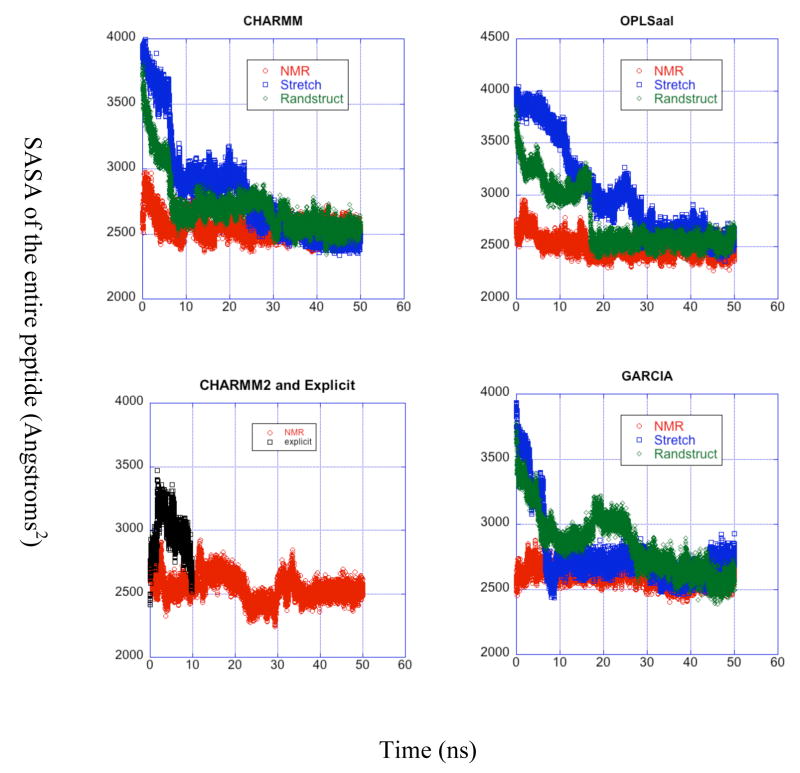
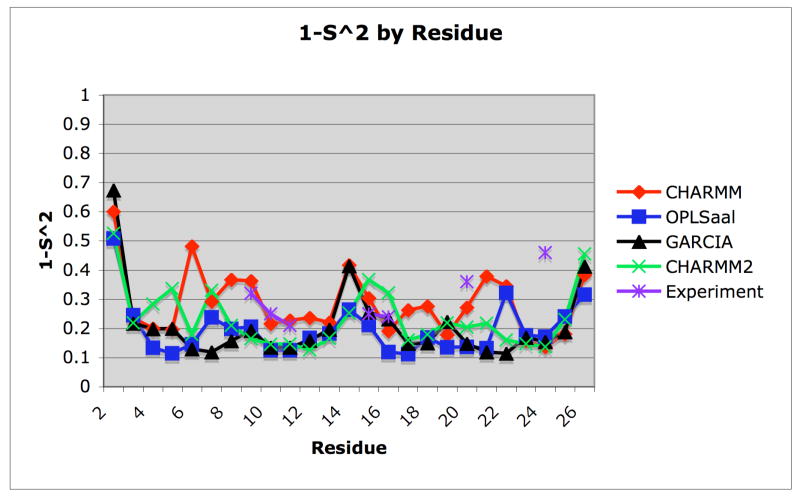
A pathogenetic feature of Alzhemier disease is the aggregation of monomeric beta-amyloid proteins (Abeta) to form oligomers. Usually these oligomers of long peptides aggregate on time scales of microseconds or longer, making computational studies using atomistic molecular dynamics models prohibitively expensive and making it essential to develop computational models that are cheaper and at the same time faithful to physical features of the process. We benchmark the ability of our implicit solvent model to describe equilibrium and dynamic properties of monomeric Abeta(10-35) using all-atom Langevin dynamics (LD) simulations, since Alphabeta(10-35) is the only fragment whose monomeric properties have been measured. The accuracy of the implicit solvent model is tested by comparing its predictions with experiment and with those from a new explicit water MD simulation, (performed using CHARMM and the TIP3P water model) which is approximately 200 times slower than the implicit water simulations. The dependence on force field is investigated by running multiple trajectories for Alphabeta(10-35) using the CHARMM, OPLS-aal, and GS-AMBER94 force fields, whereas the convergence to equilibrium is tested for each force field by beginning separate trajectories from the native NMR structure, a completely stretched structure, and from unfolded initial structures. The NMR order parameter, S2, is computed for each trajectory and is compared with experimental data to assess the best choice for treating aggregates of Alphabeta. The computed order parameters vary significantly with force field. Explicit and implicit solvent simulations using the CHARMM force fields display excellent agreement with each other and once again support the accuracy of the implicit solvent model. Alphabeta(10-35) exhibits great flexibility, consistent with experiment data for the monomer in solution, while maintaining a general strand-loop-strand motif with a solvent-exposed hydrophobic patch that is believed to be important for aggregation. Finally, equilibration of the peptide structure requires an implicit solvent LD simulation as long as 30 ns.
Figures
Similar articles
-
Long dynamics simulations of proteins using atomistic force fields and a continuum representation of solvent effects: calculation of structural and dynamic properties.Proteins. 2005 Aug 15;60(3):464-84. doi: 10.1002/prot.20470. Proteins. 2005. PMID: 15959866 Free PMC article.
-
Folding Atomistic Proteins in Explicit Solvent Using Simulated Tempering.J Phys Chem B. 2015 Jun 11;119(23):6941-51. doi: 10.1021/acs.jpcb.5b03381. Epub 2015 May 29. J Phys Chem B. 2015. PMID: 25985144
-
Free energy landscape of protein folding in water: explicit vs. implicit solvent.Proteins. 2003 Nov 1;53(2):148-61. doi: 10.1002/prot.10483. Proteins. 2003. PMID: 14517967
-
Understanding amyloid fibril nucleation and aβ oligomer/drug interactions from computer simulations.Acc Chem Res. 2014 Feb 18;47(2):603-11. doi: 10.1021/ar4002075. Epub 2013 Dec 24. Acc Chem Res. 2014. PMID: 24368046 Review.
-
Recent advances in implicit solvent-based methods for biomolecular simulations.Curr Opin Struct Biol. 2008 Apr;18(2):140-8. doi: 10.1016/j.sbi.2008.01.003. Epub 2008 Mar 4. Curr Opin Struct Biol. 2008. PMID: 18304802 Free PMC article. Review.
Cited by
-
Probing the efficacy of peptide-based inhibitors against acid- and zinc-promoted oligomerization of amyloid-β peptide via single-oligomer spectroscopy.Biophys Chem. 2012 Jan;160(1):12-9. doi: 10.1016/j.bpc.2011.08.006. Epub 2011 Sep 8. Biophys Chem. 2012. PMID: 21945664 Free PMC article.
-
Tracking the mechanism of fibril assembly by simulated two-dimensional ultraviolet spectroscopy.J Phys Chem A. 2013 Jan 17;117(2):342-50. doi: 10.1021/jp3101267. Epub 2013 Jan 7. J Phys Chem A. 2013. PMID: 23214934 Free PMC article.
-
Interaction of amyloid inhibitor proteins with amyloid beta peptides: insight from molecular dynamics simulations.PLoS One. 2014 Nov 25;9(11):e113041. doi: 10.1371/journal.pone.0113041. eCollection 2014. PLoS One. 2014. PMID: 25422897 Free PMC article.
-
Membrane-targeted strategies for modulating APP and Abeta-mediated toxicity.J Cell Mol Med. 2009 Feb;13(2):249-61. doi: 10.1111/j.1582-4934.2008.00642.x. J Cell Mol Med. 2009. PMID: 19278455 Free PMC article. Review.
-
Insight into the stability of cross-β amyloid fibril from VEALYL short peptide with molecular dynamics simulation.PLoS One. 2012;7(5):e36382. doi: 10.1371/journal.pone.0036382. Epub 2012 May 10. PLoS One. 2012. PMID: 22590535 Free PMC article.
References
-
- Pillot T, Drouet B, Queille S, Labeur C, Vandekerckhove J, Rosseneu M, Pincon-Raymond M, Chambaz J. Journal of Neurochemistry. 1999;73:1626. - PubMed
-
- Selkoe DJ. Journal of Neuropathology and Experimental Neurology. 1994;53:438. - PubMed
-
- Kelly JW. Current Opinion in Structural Biology. 1998;8:101. - PubMed
Publication types
MeSH terms
Substances
Grants and funding
LinkOut - more resources
Full Text Sources
Research Materials
Miscellaneous
