Transcriptional analysis of highly syntenic regions between Medicago truncatula and Glycine max using tiling microarrays
- PMID: 18348734
- PMCID: PMC2397509
- DOI: 10.1186/gb-2008-9-3-r57
Transcriptional analysis of highly syntenic regions between Medicago truncatula and Glycine max using tiling microarrays
Abstract
Background: Legumes are the third largest family of flowering plants and are unique among crop species in their ability to fix atmospheric nitrogen. As a result of recent genome sequencing efforts, legumes are now one of a few plant families with extensive genomic and transcriptomic data available in multiple species. The unprecedented complexity and impending completeness of these data create opportunities for new approaches to discovery.
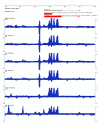
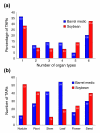
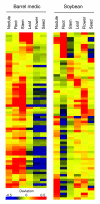
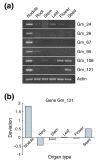
Results: We report here a transcriptional analysis in six different organ types of syntenic regions totaling approximately 1 Mb between the legume plants barrel medic (Medicago truncatula) and soybean (Glycine max) using oligonucleotide tiling microarrays. This analysis detected transcription of over 80% of the predicted genes in both species. We also identified 499 and 660 transcriptionally active regions from barrel medic and soybean, respectively, over half of which locate outside of the predicted exons. We used the tiling array data to detect differential gene expression in the six examined organ types and found several genes that are preferentially expressed in the nodule. Further investigation revealed that some collinear genes exhibit different expression patterns between the two species.
Conclusion: These results demonstrate the utility of genome tiling microarrays in generating transcriptomic data to complement computational annotation of the newly available legume genome sequences. The tiling microarray data was further used to quantify gene expression levels in multiple organ types of two related legume species. Further development of this method should provide a new approach to comparative genomics aimed at elucidating genome organization and transcriptional regulation.
Figures


Similar articles
-
Highly syntenic regions in the genomes of soybean, Medicago truncatula, and Arabidopsis thaliana.BMC Plant Biol. 2005 Aug 15;5:15. doi: 10.1186/1471-2229-5-15. BMC Plant Biol. 2005. PMID: 16102170 Free PMC article.
-
The lipoxygenase gene family: a genomic fossil of shared polyploidy between Glycine max and Medicago truncatula.BMC Plant Biol. 2008 Dec 23;8:133. doi: 10.1186/1471-2229-8-133. BMC Plant Biol. 2008. PMID: 19105811 Free PMC article.
-
LegumeIP: an integrative database for comparative genomics and transcriptomics of model legumes.Nucleic Acids Res. 2012 Jan;40(Database issue):D1221-9. doi: 10.1093/nar/gkr939. Epub 2011 Nov 21. Nucleic Acids Res. 2012. PMID: 22110036 Free PMC article.
-
Three sequenced legume genomes and many crop species: rich opportunities for translational genomics.Plant Physiol. 2009 Nov;151(3):970-7. doi: 10.1104/pp.109.144659. Epub 2009 Sep 16. Plant Physiol. 2009. PMID: 19759344 Free PMC article. Review. No abstract available.
-
Translating Medicago truncatula genomics to crop legumes.Curr Opin Plant Biol. 2009 Apr;12(2):193-201. doi: 10.1016/j.pbi.2008.11.005. Epub 2009 Jan 21. Curr Opin Plant Biol. 2009. PMID: 19162532 Review.
Cited by
-
Genome-wide analysis uncovers regulation of long intergenic noncoding RNAs in Arabidopsis.Plant Cell. 2012 Nov;24(11):4333-45. doi: 10.1105/tpc.112.102855. Epub 2012 Nov 6. Plant Cell. 2012. PMID: 23136377 Free PMC article.
-
Interrogating the transgenic genome: development of an interspecies tiling array.Syst Biol Reprod Med. 2011 Feb;57(1-2):54-62. doi: 10.3109/19396368.2010.506000. Epub 2011 Jan 10. Syst Biol Reprod Med. 2011. PMID: 21214491 Free PMC article.
-
An overall evaluation of the Resistance (R) and Pathogenesis-Related (PR) superfamilies in soybean, as compared with Medicago and Arabidopsis.Genet Mol Biol. 2012 Jun;35(1 (suppl)):260-71. doi: 10.1590/S1415-47572012000200007. Genet Mol Biol. 2012. PMID: 22802711 Free PMC article.
-
QTL analysis of seed germination and pre-emergence growth at extreme temperatures in Medicago truncatula.Theor Appl Genet. 2011 Feb;122(2):429-44. doi: 10.1007/s00122-010-1458-7. Epub 2010 Sep 29. Theor Appl Genet. 2011. PMID: 20878383 Free PMC article.
-
Global reprogramming of transcription and metabolism in Medicago truncatula during progressive drought and after rewatering.Plant Cell Environ. 2014 Nov;37(11):2553-76. doi: 10.1111/pce.12328. Epub 2014 May 11. Plant Cell Environ. 2014. PMID: 24661137 Free PMC article.
References
-
- Yamada K, Lim J, Dale JM, Chen H, Shinn P, Palm CJ, Southwick AM, Wu HC, Kim C, Nguyen M, Pham P, Cheuk R, Karlin-Newmann G, Liu SX, Lam B, Sakano H, Wu T, Yu G, Miranda M, Quach HL, Tripp M, Chang CH, Lee JM, Toriumi M, Chan MM, Tang CC, Onodera CS, Deng JM, Akiyama K, Ansari Y. et al.Empirical analysis of transcriptional activity in the Arabidopsis genome. Science. 2003;302:842–846. doi: 10.1126/science.1088305. - DOI - PubMed
Publication types
MeSH terms
LinkOut - more resources
Full Text Sources
Molecular Biology Databases
Research Materials
Miscellaneous

