. 2008 Mar 19;3(3):e1796.
doi: 10.1371/journal.pone.0001796.

Characterization and subcellular targeting of GCaMP-type genetically-encoded calcium indicators

Affiliations

Characterization and subcellular targeting of GCaMP-type genetically-encoded calcium indicators

Tianyi Mao et al. PLoS One. .

Abstract

Genetically-encoded calcium indicators (GECIs) hold the promise of monitoring [Ca(2+)] in selected populations of neurons and in specific cellular compartments. Relating GECI fluorescence to neuronal activity requires quantitative characterization. We have characterized a promising new genetically-encoded calcium indicator-GCaMP2-in mammalian pyramidal neurons. Fluorescence changes in response to single action potentials (17+/-10% DeltaF/F [mean+/-SD]) could be detected in some, but not all, neurons. Trains of high-frequency action potentials yielded robust responses (302+/-50% for trains of 40 action potentials at 83 Hz). Responses were similar in acute brain slices from in utero electroporated mice, indicating that long-term expression did not interfere with GCaMP2 function. Membrane-targeted versions of GCaMP2 did not yield larger signals than their non-targeted counterparts. We further targeted GCaMP2 to dendritic spines to monitor Ca(2+) accumulations evoked by activation of synaptic NMDA receptors. We observed robust DeltaF/F responses (range: 37%-264%) to single spine uncaging stimuli that were correlated with NMDA receptor currents measured through a somatic patch pipette. One major drawback of GCaMP2 was its low baseline fluorescence. Our results show that GCaMP2 is improved from the previous versions of GCaMP and may be suited to detect bursts of high-frequency action potentials and synaptic currents in vivo.


Conflict of interest statement

Competing Interests: The authors have declared that no competing interests exist.

Figures

Figure 1
Figure 1. Domain structures of the GCaMP-family of genetically encoded calcium indicators (GECIs) and fusion constructs.
A, Domain comparisons of GCaMP2 and GCaMP1.6; red labels indicate the differences. B, Constructs for subcellular targeting of the GECIs.
Figure 2
Figure 2. Recording backpropagating action potential responses from GECIs in hippocampal pyramidal cells.
A, Schematic showing the linescan location at the base of the apical dendrite. B, Raw linescan images (top row) showing a dark period prior to shutter opening, followed by a shutter-open fluorescence baseline and action-potential (bottom row) evoked responses (left, 3 action potentials at 83 Hz; right, 10 action potentials at 83 Hz). Fluorescence time series (middle row) were obtained by averaging over the spatial extent of the dendrite (indicated by vertical white lines).
Figure 3
Figure 3. Action-potential evoked responses in GCaMP-based GECIs.
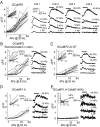
A, Amplitudes of GCaMP2 responses for individual hippocampal pyramidal cells (thin lines, left) in response to trains of action potentials given at 83 Hz, and the mean across cells (thick gray line). Dashed lines show perforated-patch recordings. Inset shows same data for 1–10 action potentials on a linear x-axis. Example single-trial responses (right) from four cells to 1, 5, 10 and 40 action potentials at 83 Hz (indicated by horizontal black lines). B, Responses of individual cortical layer 2/3 pyramidal cells (thin lines) and the group mean (thick gray line) expressing GCaMP2 after in utero electroporation (see Materials and Methods). C, GCaMP2 responses from hippocampal pyramidal cells at 34.5–35.5°C. D,E, Responses of previous versions of GCaMP family GECIs. B–E, Same conventions as in A.
Figure 4
Figure 4. Action-potential evoked responses in GECIs targeted to subcellular locations.
A, Amplitudes of the response to action potential trains at 83 Hz for the membrane-targeted GECI hCD4-GCaMP2 (left), for individual cells (thin black lines) and for the group mean (thick gray line). Insets show same data for 1–10 action potentials on a linear x-axis. Example traces (right) show single-trial responses to trains of action potentials at 83 Hz (indicated by horizontal black lines). B, Responses from the membrane-targeted construct MARCKS-GCaMP2. C, Actin-potential evoked responses from the GCaMP2-actin fusion. Conventions as in A. D–F, Action-potential responses measured simultaneously with GECIs (green curves, traces) and with the synthetic dye X-Rhod-5F (500 µM; red curves, traces). Cells were loaded with X-Rhod-5F for ≥20 min prior to data collection. Example traces show single-trial responses measured simultaneously from the green and red channels. Cells shown in D–F are different from those in Figure 3A and in panels A–C.
Figure 5
Figure 5. Accuracy of action potential detection.
Results of simulations (see Materials and Methods) giving percentage of action potential trains (for the indicated numbers of action potentials at 83 Hz) that can be detected at a 5% false positive rate for 1 second of data (i.e., such that when a time series is divided up into subsequent intervals of 1 second length, 5% of these intervals will contain a false positive). Thin dotted lines show results for individual cells and the thick black line gives the group mean.
Figure 6
Figure 6. GCaMP2 and GCaMP2-actin uncaging responses in spines.
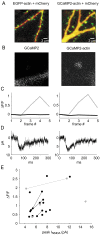
A, Apical dendrite of a CA1 pyramidal cell (left) expressing EGFP-actin (green) and mCherry (red), showing an enrichment of EGFP-actin at spines (predominantly green) compared to dendrite (predominantly red). A GCaMP2-actin fusion (right) shows a similar spine enrichment in the apical dendrite of a different CA1 cell. B, Example images showing spine and dendrite fluorescence for GCaMP2 (left) and GCaMP2-actin (right). Each image shows the baseline frame prior to uncaging. Images are median filtered in a 3×3 pixel neighborhood. C, Traces show uncaging-evoked ΔF/F fluorescence signals for ROIs covering the spine (gray) and dendrite (black) for GCaMP2 (left) and GCaMP2-actin (right). Uncaging occurs at the start of the third frame. Traces correspond to the spines/dendrites shown in B. D, Traces showing NMDA-receptor currents in response to glutamate uncaging at the spines shown in B. Each trace shows an average of 6 trials. E, ΔF/F fluorescence change in spines versus peak NMDA-receptor current versus for GCaMP2 (gray circles) and GCaMP2-actin (black circles). Lines indicate measurements taken from the same spine at different uncaging powers.
Figure 7
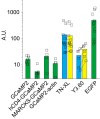
Figure 7. Brightness of the GECIs compared.
GECIs were expressed (34–48 hours) in pyramidal cells and brightness was measured as the mean fluorescence intensity collected in linescan mode across the base of the apical dendrite. Each plot symbol shows a single cell, except for the FRET probes in which symbols connected by a dashed line indicate cyan and yellow channel measurements from the same cell. Illumination was 7 mW at the objective back aperture (see Materials and Methods for details).

References

    1. Regehr WG, Connor JA, Tank DW. Optical imaging of calcium accumulation in hippocampal pyramidal cells during synaptic activation. Nature. 1989;341:533–536. - PubMed
    1. Tank DW, Sugimori M, Connor JA, Llinas RR. Spatially resolved calcium dynamics of mammalian Purkinje cells in cerebellar slice. Science. 1988;242:773–777. - PubMed
    1. Jaffe DB, Johnston D, Lasser RN, Lisman JE, Miyakawa H, et al. The spread of Na+ spikes determines the pattern of dendritic Ca2+ entry into hippocampal neurons. Nature. 1992;357:244–246. - PubMed
    1. Callaway JC, Ross WN. Frequency-dependent propagation of sodium action potentials in dendrites of hippocampal CA1 pyramidal neurons. J Neurophysiol. 1995;74:1395–1403. - PubMed
    1. Helmchen F, Imoto K, Sakmann B. Ca2+ buffering and action potential-evoked Ca2+ signaling in dendrites of pyramidal neurons. Biophys J. 1996;70:1069–1081. - PMC - PubMed

Publication types