. 2008 Mar 19;3(3):e1825.
doi: 10.1371/journal.pone.0001825.

Detailed enzyme kinetics in terms of biochemical species: study of citrate synthase

Affiliations

Detailed enzyme kinetics in terms of biochemical species: study of citrate synthase

Daniel A Beard et al. PLoS One. .

Abstract

The compulsory-ordered ternary catalytic mechanism for two-substrate two-product enzymes is analyzed to account for binding of inhibitors to each of the four enzyme states and to maintain the relationship between the kinetic constants and the reaction equilibrium constant. The developed quasi-steady flux expression is applied to the analysis of data from citrate synthase to determine and parameterize a kinetic scheme in terms of biochemical species, in which the effects of pH, ionic strength, and cation binding to biochemical species are explicitly accounted for in the analysis of the data. This analysis provides a mechanistic model that is consistent with the data that have been used support competing hypotheses regarding the catalytic mechanism of this enzyme.


Conflict of interest statement

Competing Interests: The authors have declared that no competing interests exist.

Figures

Figure 1
Figure 1. Basic compulsory-order ternary-complex mechanism.
The basic ordered mechanism for the general reaction formula image, with a = [A], b = [B], p = [P], and q = [Q] is illustrated. The four states refer to unbound enzyme (state 1), enzyme-substrate A complex (E·A, state 2), enzyme-substrate A-substrate B complex (E·AB, state 3), and enzyme-product Q complex (E·Q, state 4). The four steps of the catalytic cycle are detailed in Equation (1).
Figure 2
Figure 2. Fits to kinetic data from on the forward operation of kidney enzyme.
Measured flux as a function of substrate concentrations was obtained from Figures 2, 3, 6, 7, and 9 of . Initial fluxes (µmol of COASH (or CIT) synthesized per minute per µg of enzyme) measured at the substrate concentrations indicated in the figures. For A, B, and D, the initial product (CIT and COASH) concentrations are zero. C. Flux measured with COASH added in various concentrations to investigate the kinetics of product inhibition. All data were obtained at pH = 8.1 at 28°C. Model fits are plotted as solid lines.
Figure 3
Figure 3. Fits to kinetic data from on the reverse operation of kidney enzyme.
Measured reverse flux as a function of concentrations of CIT and COASH was obtained from Figures 4 and 5 of . Initial fluxes (µmol of COASH (or CIT) synthesized per minute per µg of enzyme) measured at the substrate concentrations indicated in the figures. All data were obtained at pH = 8.1 at 28°C. Model fits are plotted as solid lines.
Figure 4
Figure 4. Fits to kinetic data from on the forward operation of liver enzyme.
Measured flux in arbitrary units was obtained from Figures 1,2,5, and 6 of . For all cases the product (CIT and COASH) concentrations are zero and total substrate and inhibitor concentrations are indicated in the figure. A and B report data obtained with no inhibitors present. C. The relative activity (normalized to its maximum) of the enzyme is plotted as functions of [ATP], [ADP], and [AMP] measured at [ACCOA] = 11 µM and [OAA] = 1.9 µM. D. The measured flux is plotted as a function of [ACCOA] at [OAA] = 34 µM with ATP, ADP, and AMP present as indicated in the figure. All data were obtained at pH = 7.4 at 25°C. Model fits are plotted as solid lines.
Figure 5
Figure 5. Impact of [Mg2+] and pH on liver enzyme.
Measured flux in arbitrary units was obtained from Figures 13 and 14 of . A. The relative activity (normalized to its maximum) of the enzyme is plotted as functions of [ATP] at [Mg2+] = 0 mM (shaded circles), 0.5 mM (shaded triangles), 1.0 mM (shaded squares), 2.0 mM (open circles), and 4.0 mM (diamonds). B. Relative activity is plotted as a function of pH. Substrate concentations are [ACCOA] = 21 µM and [OAA] = 8.6 µM. All data were obtained at 25°C. pH is fixed a 7.4 for A. Model fits are plotted as solid lines.
Figure 6
Figure 6. Inhibition of cardiac enzyme.
Measured flux in arbitrary units was obtained from Figures 1 and 2 of . A. Flux is plotted as a function inhibitor ATP concentration for [ACCOA] = 16 µM and [OAA] = 1.13 and 2.25 µM. B. Flux is plotted as a function of [ACCOA] at [OAA] = 5 µM at three different concentrations of ATP indicated in figure. C. Flux is plotted as a function of [ACCOA] at [OAA] = 3.1 µM at three different concentrations of SCOA indicated in figure. All data were obtained at pH = 7.4 at 21°C. Model fits are plotted as solid lines.
Figure 7
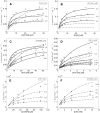
Figure 7. Analysis using random-order model of Equation (26).
Data and conditions in A, B, C, and D are the same as for Figure 2. Data and conditions for E and F are the same as for Figures 3A and 3B, respectively Parameter values for solid line model predictions are Vmax = 0.320 µmol·min−1· µg−1, KmB = 6.20 µM, KmP = 8.00 µM, KeA = 1.35 µM, KeB = 1.10 µM, KeP = 21.6 nM, KeQ = 0.150 µM. Parameter values for dashed line model predictions are Vmax = 0.526 µmol·min−1·µg−1, KmB = 36.6 µM, KmP = 80.792 mM, KeA = 3.08 nM, KeB = 10.8 nM, KeP = 0.152 µM, KeQ = 17.0 µM.

References

    1. Alberty RA. Relations between biochemical thermodynamics and biochemical kinetics. Biophys Chem. 2006;124:11–17. - PubMed
    1. Alberty RA. Levels of thermodynamic treatment of biochemical reaction systems. Biophys J. 1993;65:1243–1254. - PMC - PubMed
    1. Teusink B, Passarge J, Reijenga CA, Esgalhado E, van der Weijden CC, et al. Can yeast glycolysis be understood in terms of in vitro kinetics of the constituent enzymes? Testing biochemistry. Eur J Biochem. 2000;267:5313–5329. - PubMed
    1. Vinnakota K, Kemp ML, Kushmerick MJ. Dynamics of muscle glycogenolysis modeled with pH time course computation and pH-dependent reaction equilibria and enzyme kinetics. Biophys J. 2006;91:1264–1287. - PMC - PubMed
    1. Lambeth MJ, Kushmerick MJ. A computational model for glycogenolysis in skeletal muscle. Ann Biomed Eng. 2002;30:808–827. - PubMed

Publication types

Substances